This blog post provides a bit more detail and background information about my new publication
A Land Cover Atlas of the United Kingdom. It's basically a
23 page pdf accompanied by a set of
392 maps of land cover - one for each local authority in the UK, plus an overview map of the whole UK. The publication date kept getting pushed back because I was also
working with the BBC on the topic and we wanted to ensure things went online at the same time. I have once again chosen
Figshare to host this as it's an excellent platform for dissemination of this type of data. The Atlas uses
Corine Land Cover 2012 data and was the result of a spare time summer project that I recently finished. See below for an example of one of the local authority maps, from Tonbridge and Malling in Kent, in the South East of England.
 |
| Tonbridge and Malling - a fairly fruity landscape |
There are plenty of
other land cover maps, and this is
not new data, but I wanted to show what it looks like at the local level in a set of static maps and I hadn't seen it presented like that before; so it's kind of a new take on existing data. I did this partly because I wanted to be able to understand how areas differ but also because I wanted a better idea of the diversity of land cover at the local level across the UK in a way that was easy to digest. That's what I've attempted here. I'll leave it to the reader to decide if it works, but I quite like the results as it give me a better understanding of land cover nationwide.
The rest of this post just provides a little bit more background detail to the Atlas project itself and some of the decisions I made in producing it, including a few pictures.
First of all, I wanted this to cover the whole UK. I thought it would be interesting to be able compare
all 391 local authorities in terms of their land cover. It's always a bit annoying when you see some great data but your part of the country isn't included! The Corine classification has a total of 44 land use classes but since it covers the whole of Europe there are some categories that don't appear in the UK - such as Glaciers. This leaves a total of 39, though some of these 'land cover' categories are actually water.
Anyway, each map legend lists all possible land cover categories so that you can easily compare places and the proportion of different land types in them. I thought it was also important to be able to identify what land cover types areas don't have, that's why you'll see a legend entry for a category even if it doesn't appear on the map.
I also wanted the project to be based on open data and open source software, so I used Corine (open), Ordnance Survey data (open), Source Sans Pro font (open) and QGIS (free, open source). See the images below for a bit more on this kind of thing.
 |
| Not that it really matters, but I do like an open font |
 |
| This map extract is from the Angus council area in Scotland |
 |
| This was a spare time project that got out of hand |
 |
| I also wanted to show what land cover areas do not contain |
 |
| Values <1% are shown in light font |
 |
| Scale is always shown, but areas differ hugely in size |
 |
| Some slight boundary line mismatches - later maps will have a fix |
This all started with me wanting to investigate what percent of the UK is 'urban' and how much is 'golf course' using the new OS
greenspace data. I got to the bottom of the
latter but in relation to the former it really does depend upon how you measure it. I don't believe there is a definitive answer but if I was pressed, I'd always say less than 10%. Corine data suggests it is about 6%.
Take a look at the
Atlas document itself if you're interested - and then check out the
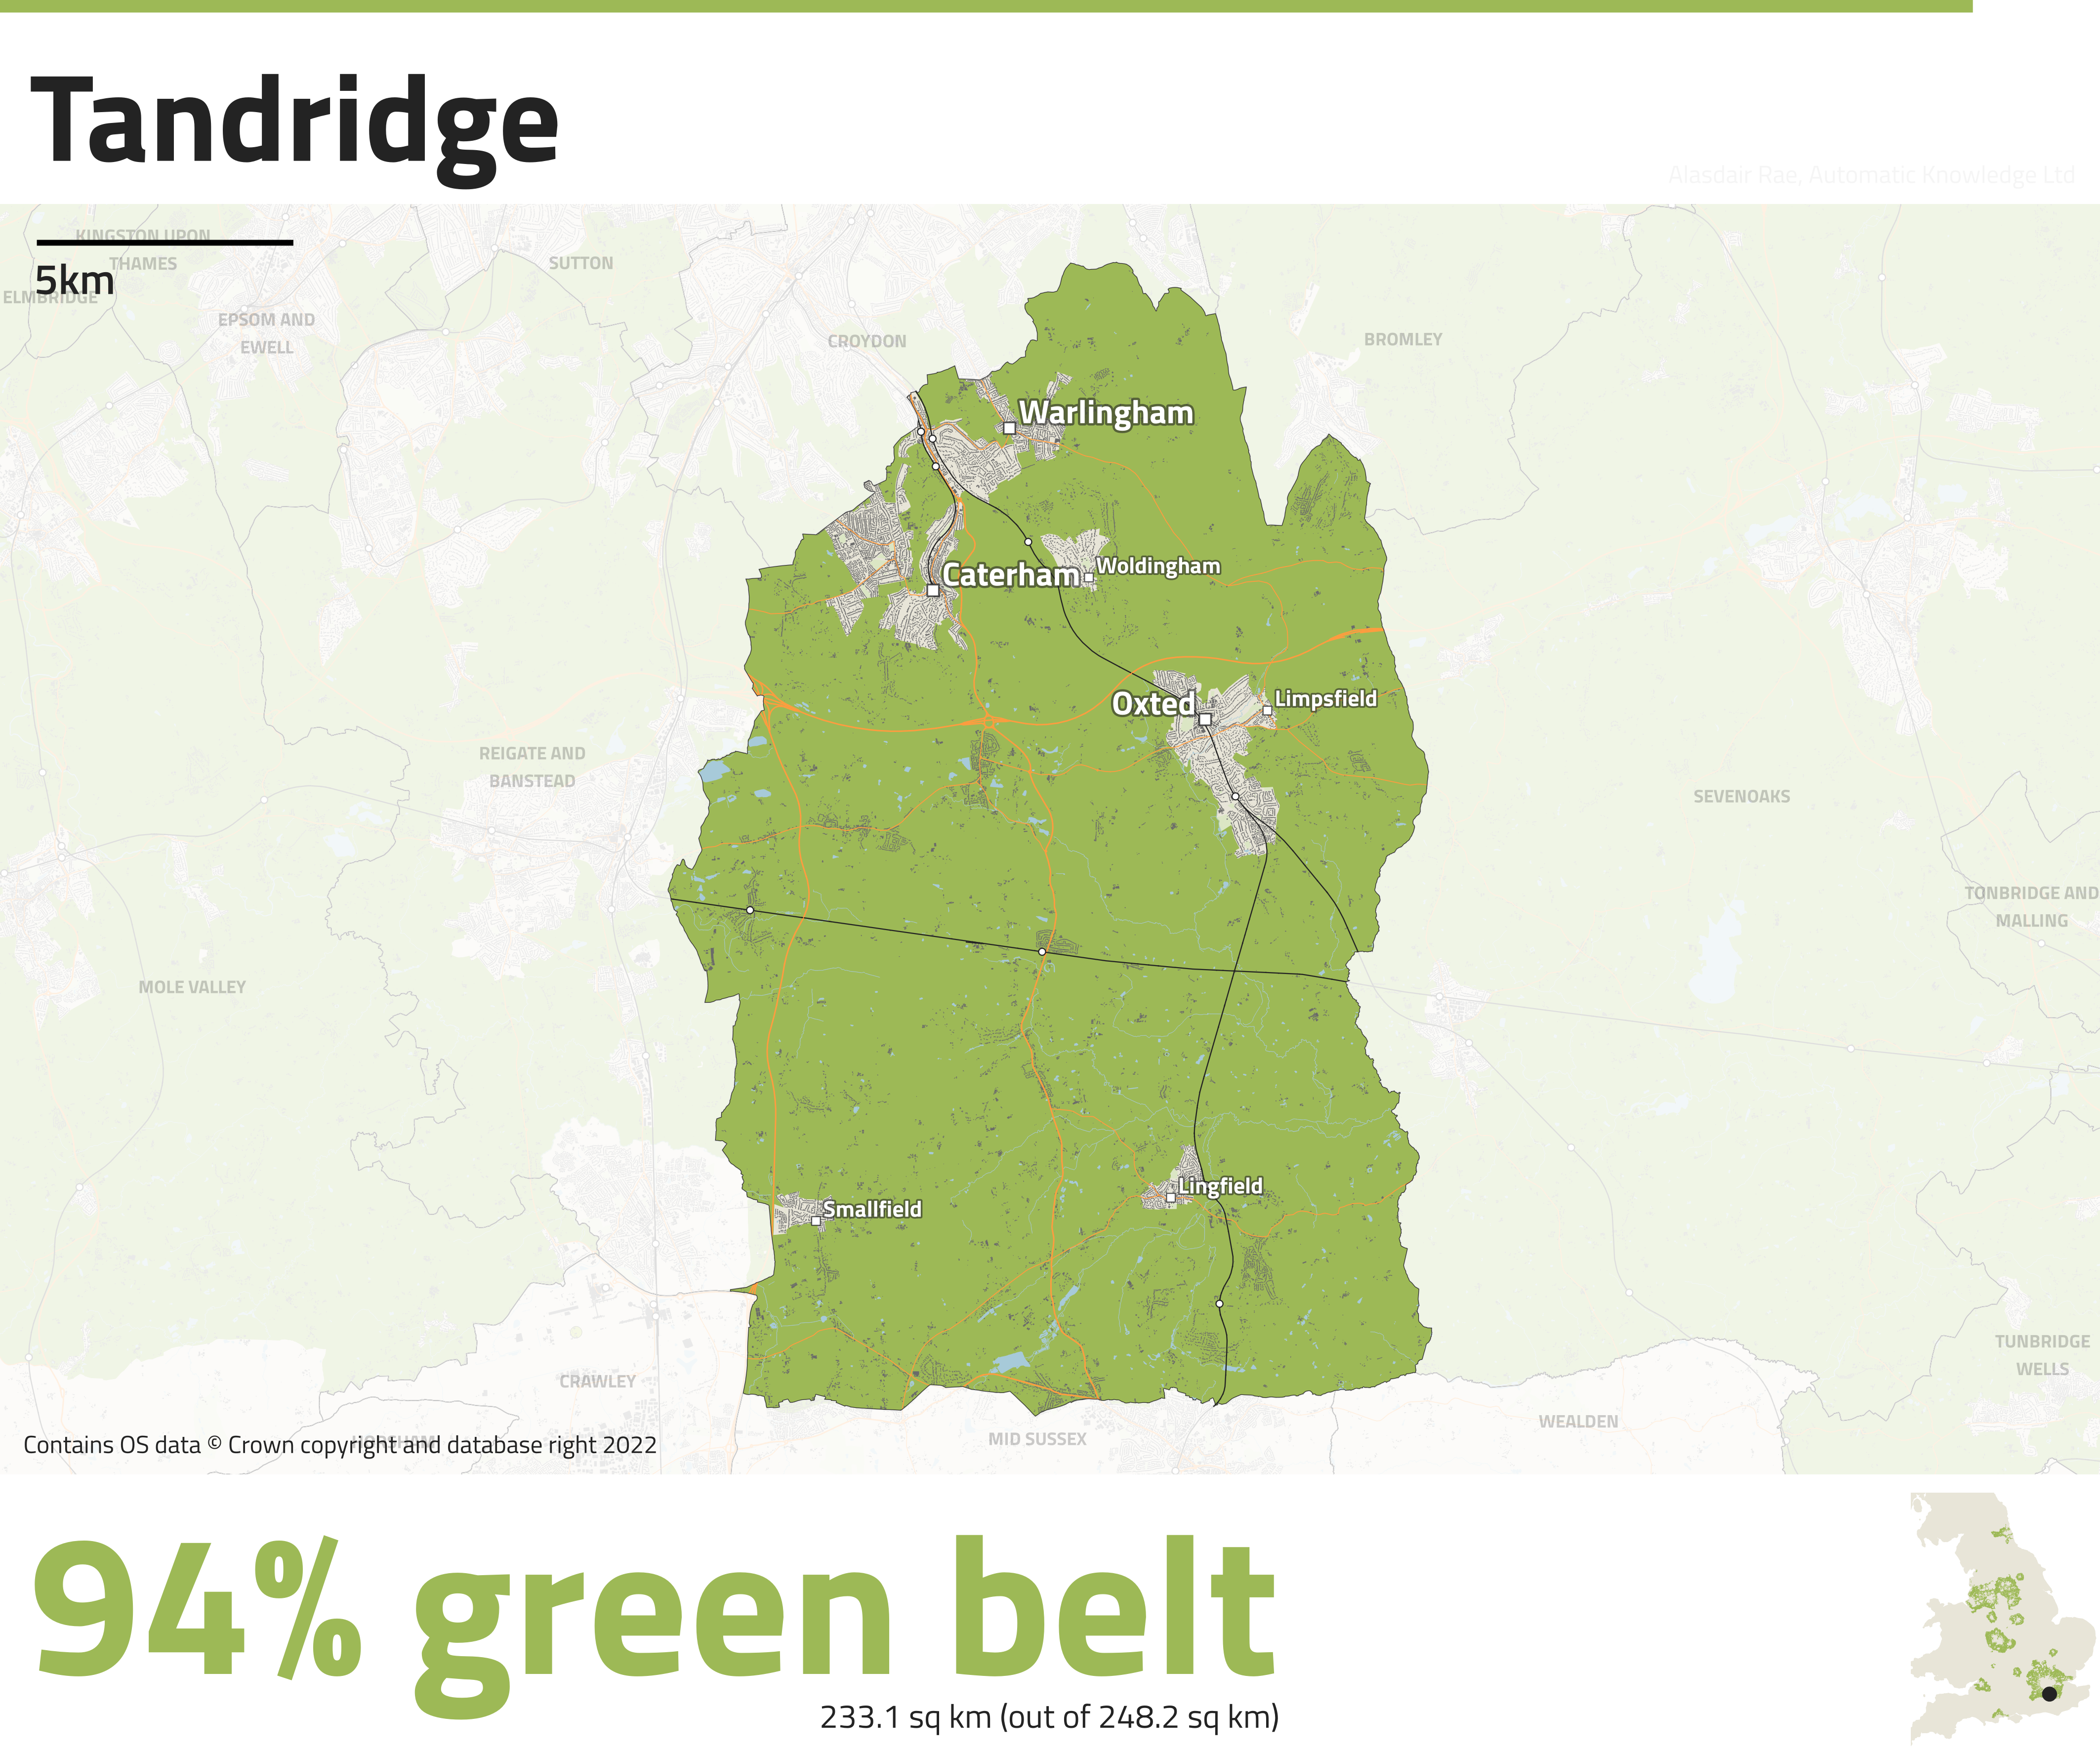
map for your area. You can also see more about this in a related BBC story, for which I produced a set of simplified Corine maps that are much easier to digest because they only show four categories.
In the BBC piece, I also decided to show building footprints, as a way to add a little more detail and legibility to the maps. This meant I had to create a set of files with all UK buildings in it. For Great Britain this was pretty time consuming, but straightforward. For Northern Ireland I had to create it using open data. But the end result was quite satisfying and after a bit of to-and-fro with
Tom Armitage from Digimap to confirm my figures I was ready to go. As it happens, the total area of the UK covered by buildings amounts to about 1.3%. In Great Britain overall it's about 1.4%, which is much higher than, say, the land covered by golf courses: 0.54%. I have also calculated these figures at local authority level, but that's one for another day.
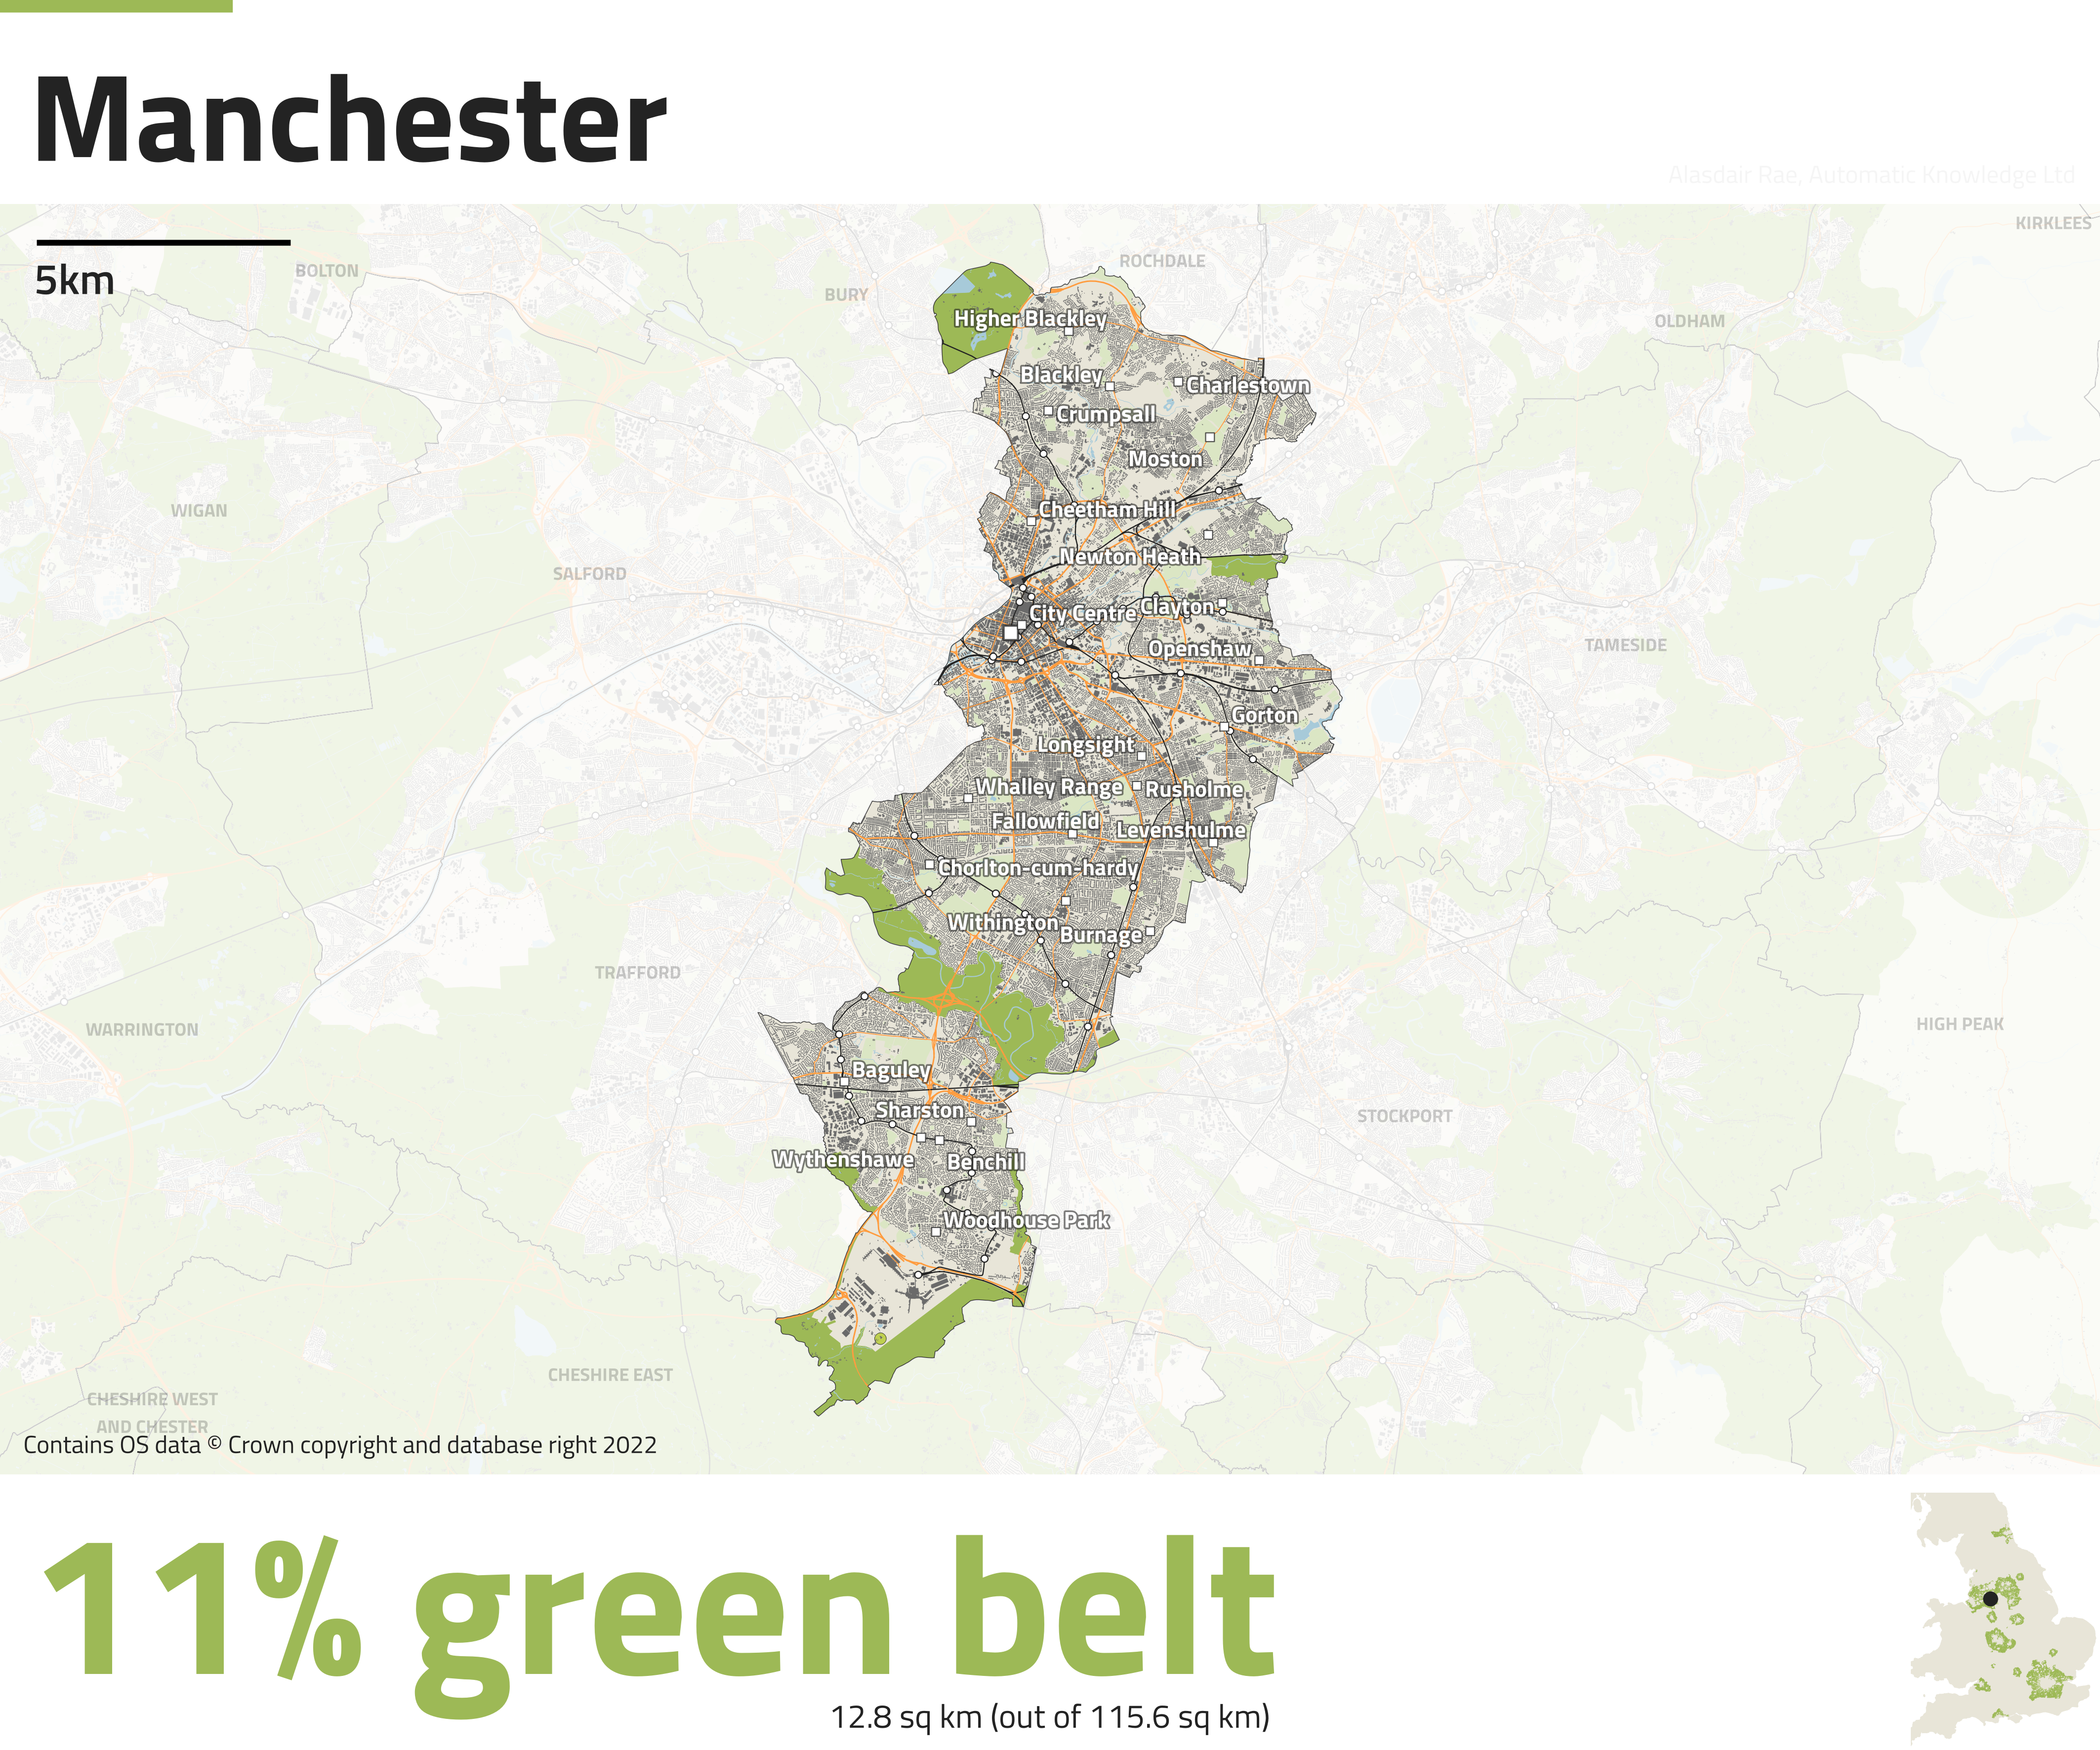
Mind you, if you are stuck for something to say during a lull in conversation, you might want to interject with "I say, did you know that Islington is 30% building, and that Birmingham and Manchester are both 15% building?".
Notes: I have done my best to map this as accurately and clearly as possible. If you do spot any mistakes, please feel free to get in touch. Like I said above, there are other methods for mapping land cover and there are other data sources so don't take this as the definitive account. Having said this, I think it provides a good overview of land cover in the UK at a local level. There are some further notes on these kinds of things in my Atlas document, on page 3. The Appendices also contain data tables on land cover for each part of the UK.


