Showing posts with label green belt atlas. Show all posts

Saturday, 21 May 2022

English Green Belt Atlas, v5

Where is the green belt? Where are the green belts? How much of my area is green belt land? These are excellent questions, but it's not always super easy to find the answer, and that's why I originally began investigating this topic back in 2012. This then eventually led to me producing maps for each English local authority that had green belt land in it, thanks to an idea suggested to me by geo legend Prof Bob Barr. Since I last did this in 2018 the number of local authorities in England has changed and there is a more recent green belt dataset, so I'm returning now with version 5 of my English Green Belt Atlas. Currently, 12.4% of land in England is designated as green belt, across 180 local authorities, but it varies a lot between places, as you can see below. I have made one map for each of the 180 areas, listed alphabetically (they are really high resolution images). How big is 12.4% of England? It's 16,140 square kilometres or 6,232 square miles. This is just a little bigger than the South East region or Yorkshire and the Humber, and about 80% the size of Wales, just to give a sense of scale. From 2020 to 2021 there was a 0.1% decrease in the amount of green belt land.

I did my best with the labelling

I've tried to keep the maps fairly simple


An example of a very split local authority area (rail line)


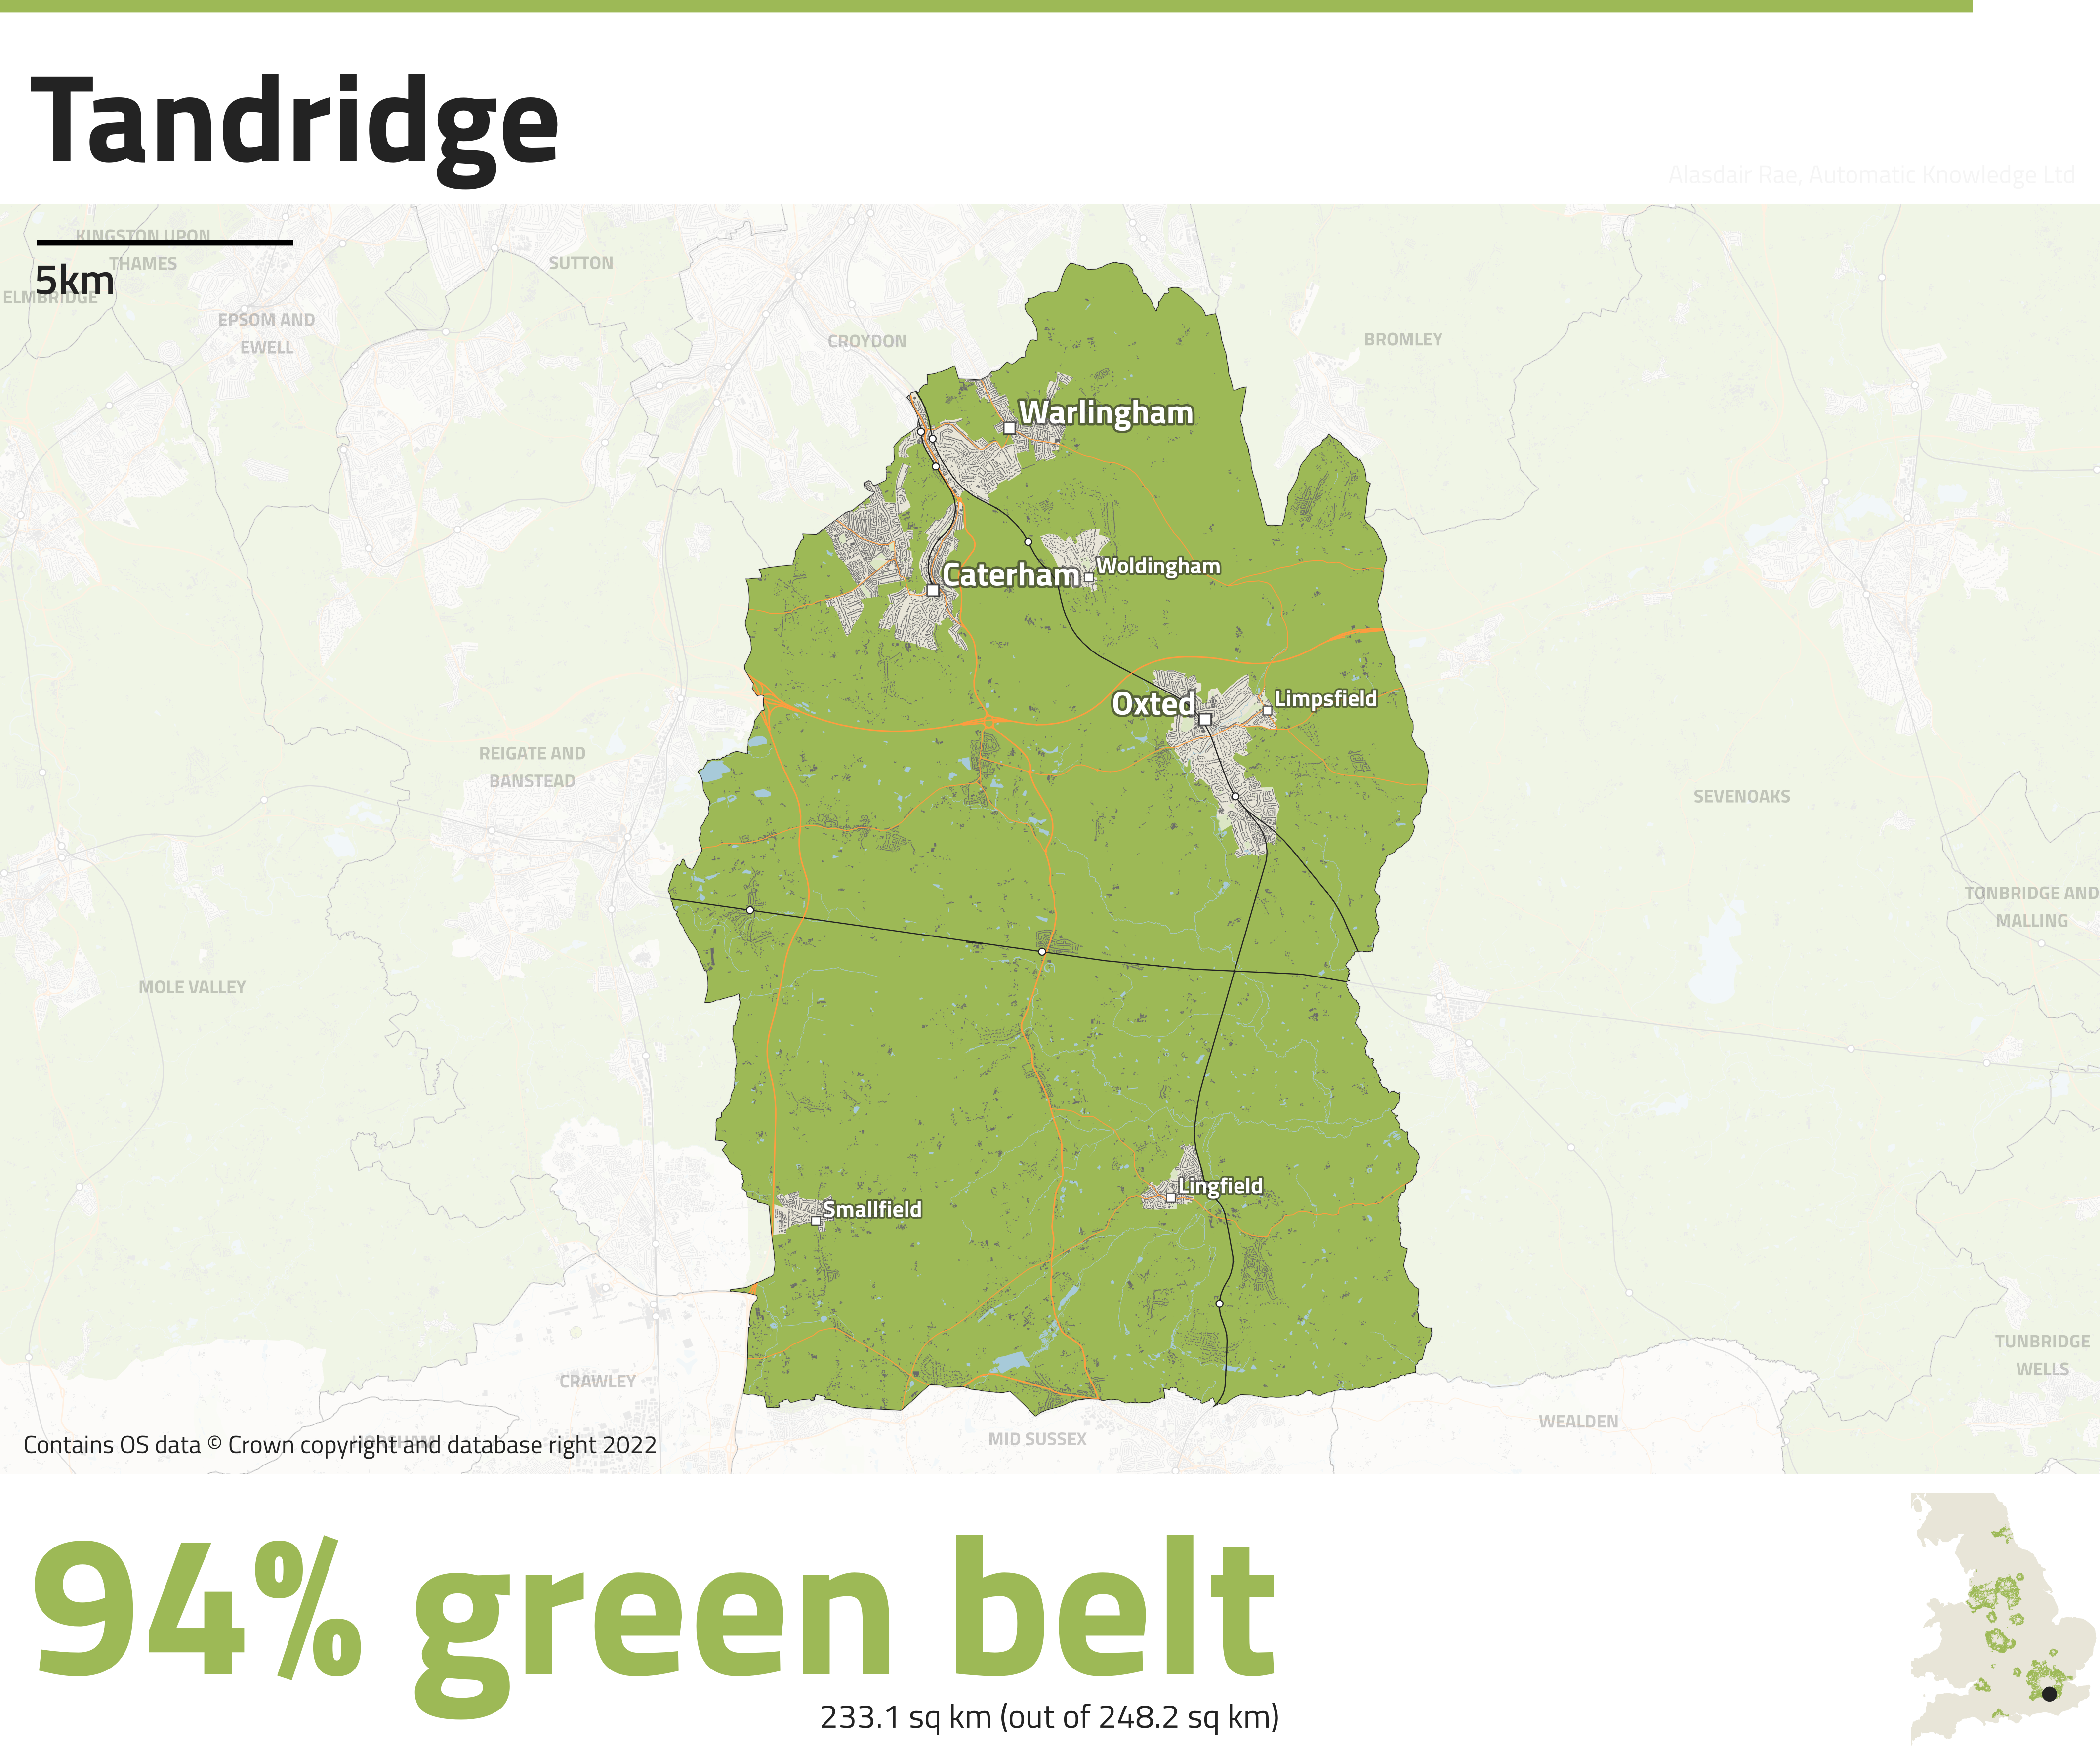
This area has the highest % green belt land in England


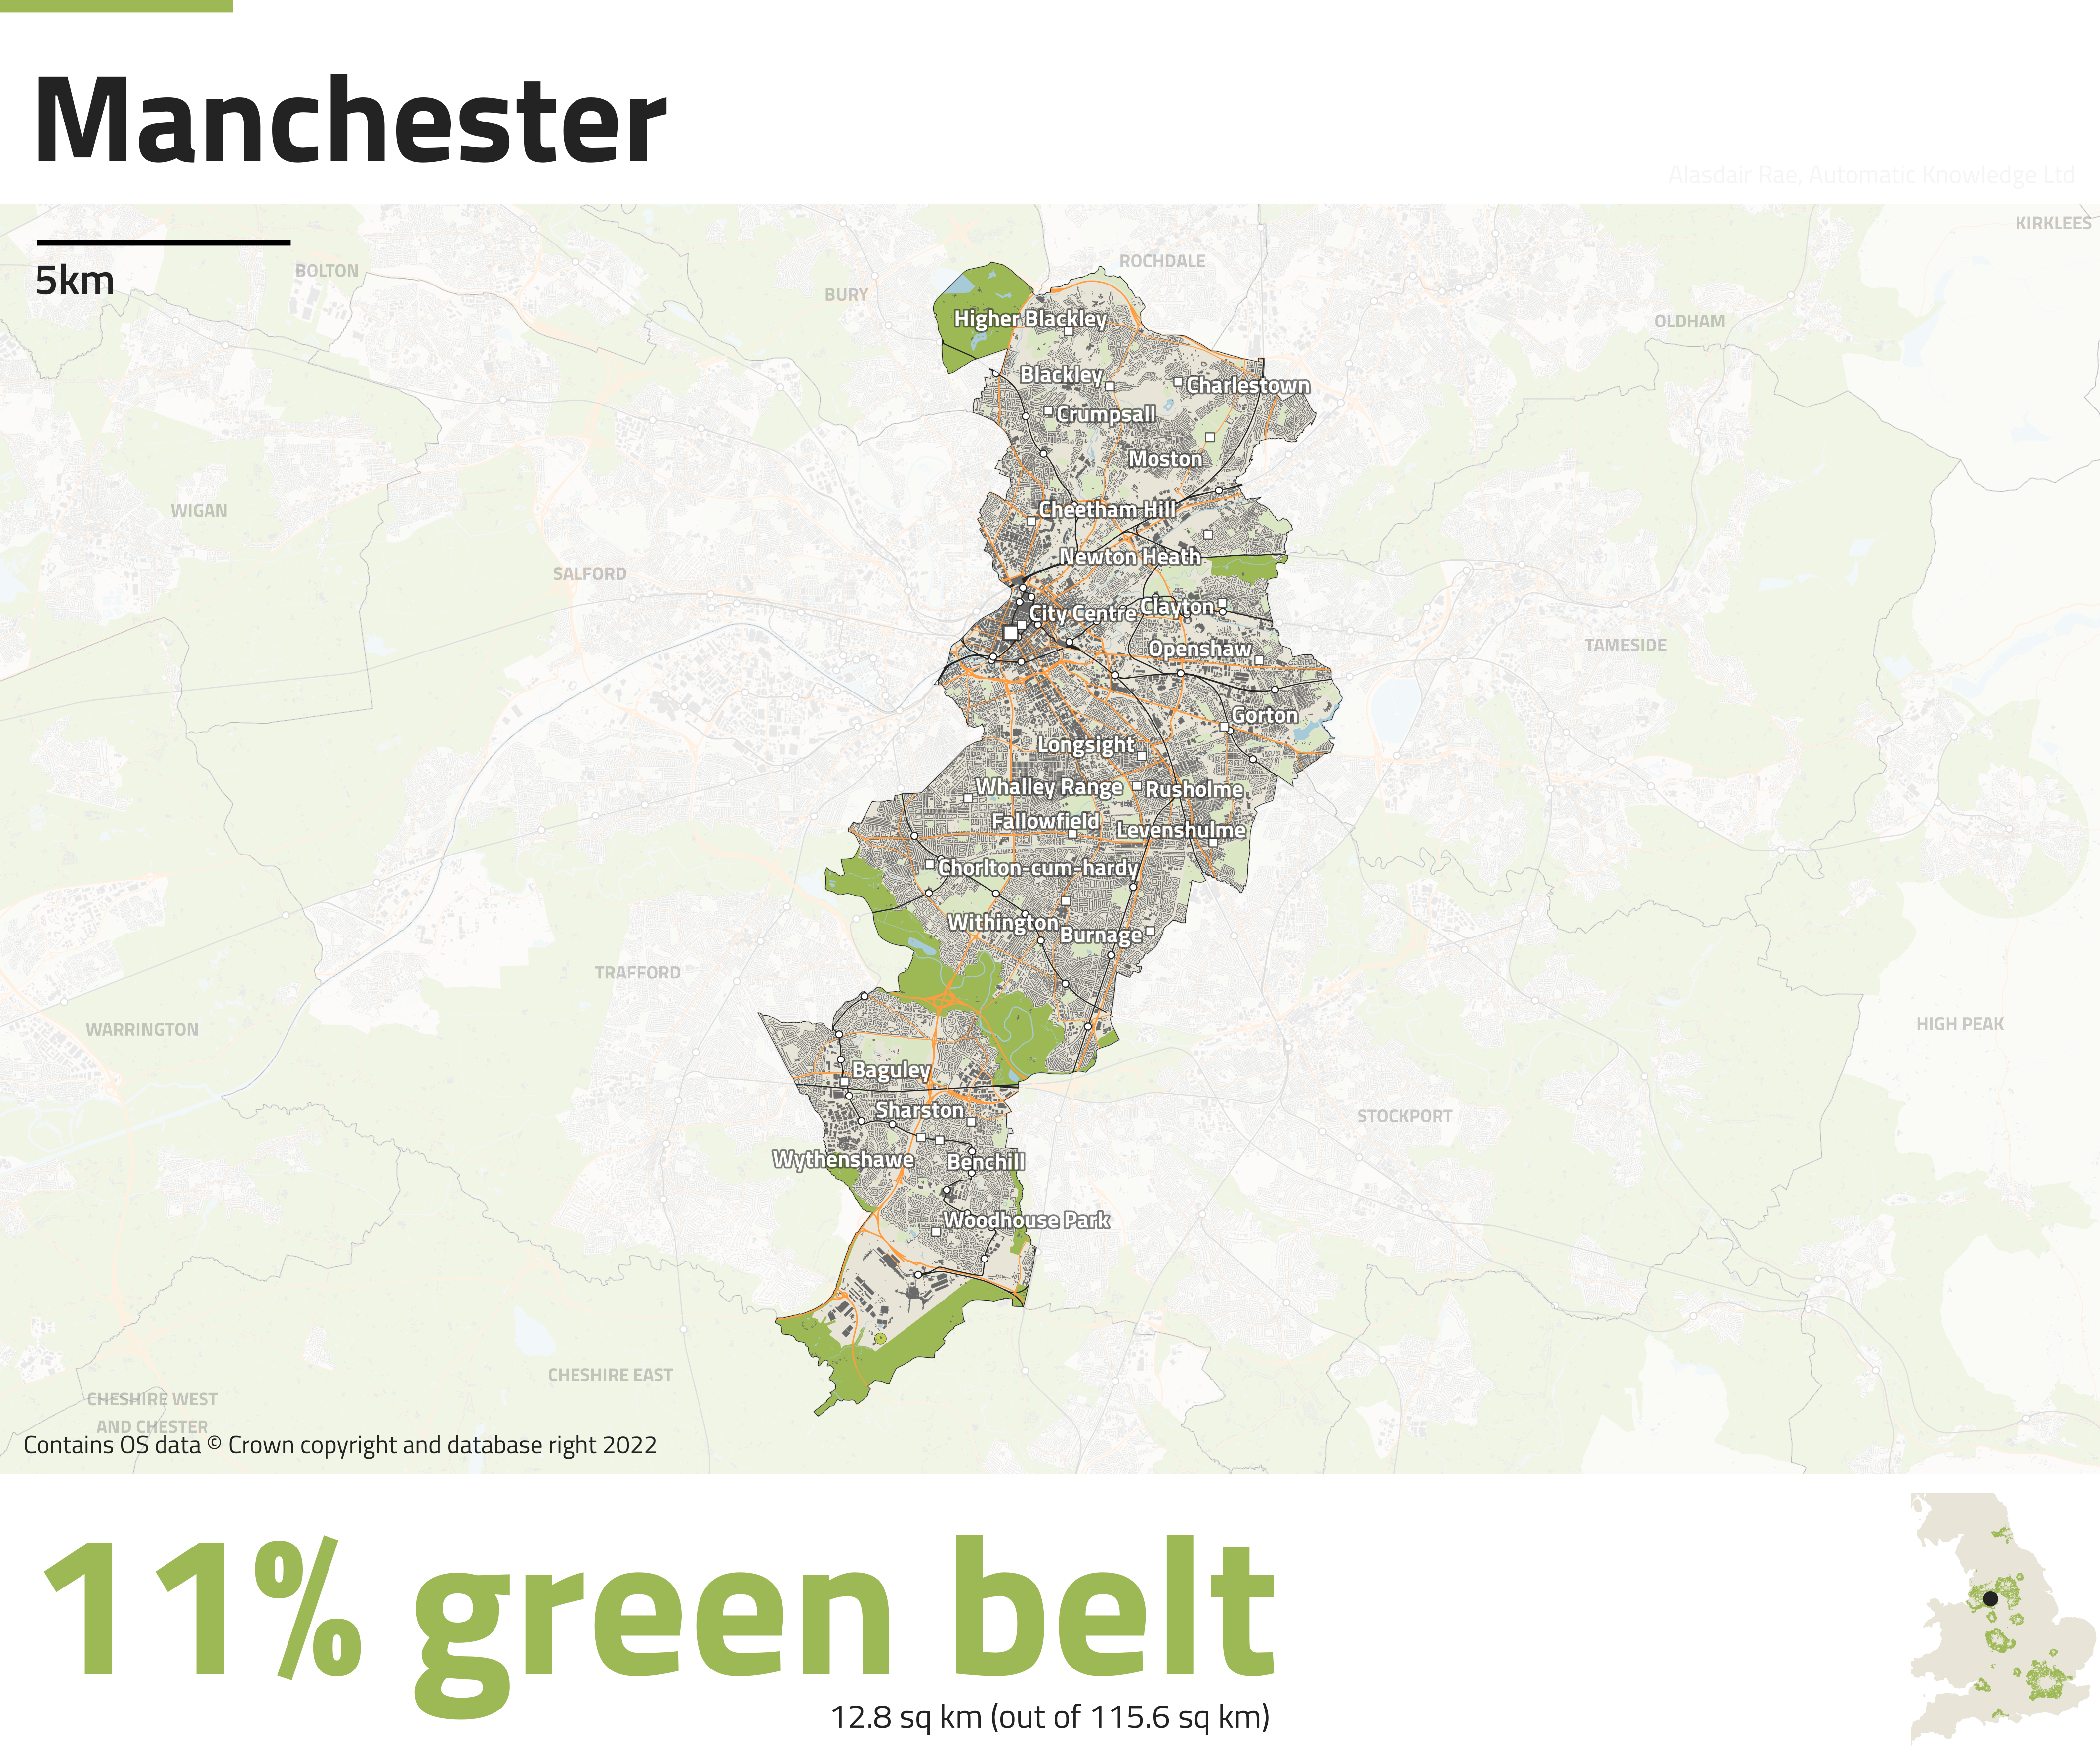
Not an awful lot of green belt land here


Okay, so you get the idea with the maps - I've shown rail lines (dark), railways stations (little circle dots), places (square dots, different sizes), major roads (orange), buildings (dark), water, green space (light blue) and green belt land in a darker green. The little dot in the bottom right inset map shows you where a local authority is, just in case any are not familiar. I've automated the labelling but it's not 100% perfect, but I can't spend any more time on it. Want to use one of these maps, or all of them? Be my guest.

Here's a few more that I found interesting. You can find the full set, listed alphabetically, right here.


Friday, 20 July 2018

Map Layout Design in QGIS Atlas

This is a short follow-up post from the previous one, where I posted an update of my Green Belt Atlas. It's about my on-going quest to try to make clearer, better maps and in particular the choices that went into the final layout. I was quite happy with the style and layout but don't claim it's perfect by any means. Anyway, here goes. Scroll to the bottom of the page for some screenshots of what settings I used in QGIS to create this.

These captions explain things in more detail - click to enlarge

As you can see from the image above, basically everything I've done here has some kind of logic or reasoning behind it. 

The top white space is for the name of each local authority. This means there is a lot of white space when that place is York, as above, but I needed to ensure that when the Atlas shows somewhere with a longer name (e.g. Windsor & Maidenhead) it still fits in.

The font throughout is Raleway, still a favourite of mine, and also free. The only thing I'm not so keen on is the the numbers but I can live with it.

I also added some explanatory/contextual text at the bottom of each map, which pulls in data from the Atlas coverage layer in QGIS. I think this adds some valuable information to help readers interpret things more clearly. I tend not to use black at all these days, and instead go for #222222 (RGB 34, 34, 34) as it's less stark.

The inset map in the top right is also pretty small but works well I feel and for a locator I have just used an off-black dot, again to keep it simple. I do like the kind of faded, cloudy white background effect so that you see enough to give you an idea of what's there but your eyes are still drawn to the main feature.

The really important thing for me was to try to keep things simple but at the same time allowing the reader to get the maximum amount of information out of the underlying dataset. But since this was QGIS Atlas and automated mapping I also had to make sure that when QGIS iterates through each page of the Atlas (all 186 of them), it didn't cause any label or placement conflicts, and this is not always easy. 

If you're thinking about getting into using the QGIS Atlas tool, I've got a tutorial here (with all the data and project files you'll need to play around with it) but it also links to a simpler, previous example.

Anyway, that's all for now. Have a read of all the captions in the image to get more of a sense of my thinking on this little project.


This is the query you use to only show points in the Atlas feature


The is the NOT query used for the background mask layer


And this is the symbology used for the mask layer above

Saturday, 14 July 2018

Green Belt Atlas, version 4

This is a short post about an updated version of my Green Belt Atlas, in which I've produced a map of every local authority in England that contains land designated as green belt. The original idea for this came from GIS guru Bob Barr a couple of years ago and there have been a few versions so far but this one uses the latest data and includes some new features and improvements. Here's a sample map, for York. I'm going to do a follow-up post about some of the technical stuff.

As you can see, York is 82% green belt

I have put all 186 local authority maps in a public folder, so you can check that out if you're interested. I'll post a selection here as well. If you want to find out more about green belts and their history, I'd recommend reading John Grindrod's Outskirts.

See the whole lot here

This version of the Atlas is, I think, an improvement on previous ones I've produced. I'll cover more of the technical details and design choices in the next blog post but for now I'm just posting the maps, and a bit of summary data.

The reason I've done this is because I'm interested in land use, land cover and suchlike, and I know others are too. This version of the Atlas uses the latest data (2016-17 green belt boundaries), which you can find on data.gov.uk, along with data for previous years.

Here are a few green belt maps from the full set, just click an image to enlarge, or go to the full set if you want a  high resolution download. Green areas are land designated as green belt, and I've also shown buildings, roads, railways and I've added some place names. A summary datasheet for all 186 areas can be found here as well as at the bottom of the page.

But wait! Why map this at a local authority level? Well, clearly the green belts were not designated at the individual local authority level, and that's fine. But if we're looking at the kinds of things local planning authorities have responsibility for (e.g. housing) then they do need to be aware of this kind of thing, in my opinion. The Plain English guide to the planning system (paragraph 32) is a good reference point for this:

"This means that the requirement to meet housing needs must be balanced against other important considerations, such as protecting the Green Belt or addressing climate change and flooding."

So, my view is that it's entirely logical and sensible to look at this from a local perspective. 


Full green belt spreadsheet