Let's begin with a story, from some time around the early 1990s in the north of Scotland. I used to go to a church in Inverness with my Mum when I was growing up and although I've forgotten lots of things, one of the things I do remember is the minister asking this question at the start of a sermon:
- "What's the shortest way to London?"
He didn't say from where, but of course most people thought of the question in relation to where they were at the time. I can't remember exactly what the rest of the sermon was about, but since we were in Inverness, I was thinking maybe either the shortest route to London was the direct train from Inverness to Kings Cross, or maybe the Sleeper from Inverness to Euston or perhaps a flight from Inverness Airport to London Heathrow or Gatwick.
The answer, of course, was that the shortest way to London was 'good company'. Cliché 101, but of course it's true. Oh, by the way, if you type 'shortest way to [city of your choice]' into Google then you should see a result straight away with a map preview on the results page - like in the example below that appeared when I typed 'shortest way to Amsterdam' into Google just now.
What have we learned so far? That a) Inverness to London is longer than Sheffield to Amsterdam; b) there's always more than one way to get from A to B; and c) sometimes the answer to a question is more abstract than you'd think. But also d) people often remember weird stuff.
If someone asked the "What's the shortest way to London?" question online, today, I imagine the answers would look something like this:
- "Which London? London, England? London, Ontario? London, Kiribati? You need to be clearer and not make assumptions!"
- "Where from? What's your starting point? Please clarify!!!"
- "Why don't you go to Norwich instead of London?"
- "The UK is finished, don't bother with London."
- "Why are you so London-centric? Not EVERYTHING'S about London you know."
- "Actually London is bad."
- "You're taking the train? Communist!"
- "Why are you not already IN London?"
[TENUOUS SEGUE JUST LIKE IN THAT SERMON WHERE I FORGOT EVERYTHING APART FROM THE 'SHORTEST WAY TO LONDON' BIT]
Okay, but this piece has a click-bait title so let's get straight to the point. Actually, let's not. Let's talk about things a bit more first, starting with geospatial file formats because we can't do much in GIS without data (apart from argue about file formats). But yeah, the best GIS software is the one that you enjoy being with, probably.
My favourite geospatial file format
The disgraceful truth is that I have quite weak opinions about geospatial file formats, and I don't really dislike any of them. In fact, I'd say I'm still friends with them all. From an abstract point of view, my favourite file format is the one that makes it easiest to get stuff done. Right now, and for the past few years,
my favourite file format is definitely the geopackage and it will likely remain this way for a long time. This is because it's a single file, it can be 1KB or 10GB and it just doesn't complain. And also because it just works for me, with no fuss, particularly
when I want to share GIS data on the web, as I often do.
All this sounds a bit like a dig at our old and trusted friend, the Shapefile. But it's not really. In fact, I really do agree with the view of the geopackage and Shapefile that I read on the
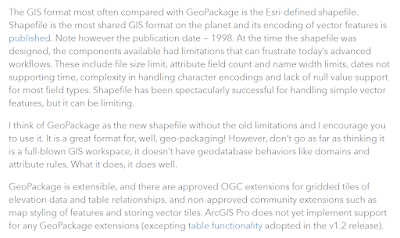
ESRI® blog a while back. This bit of text in particular is about right - the shapefile 'has been spectacularly successful'.
"The GIS format most often compared with GeoPackage is the ESRI-defined shapefile. Shapefile is the most shared GIS format on the planet and its encoding of vector features is published. Note however the publication date — 1998. At the time the shapefile was designed, the components available had limitations that can frustrate today’s advanced workflows. These include file size limit, attribute field count and name width limits, dates not supporting time, complexity in handling character encodings and lack of null value support for most field types. Shapefile has been spectacularly successful for handling simple vector features, but it can be limiting."
But really, I don't use files above 2GB every day, though I do it enough that the geopackage format means I don't have to think about it when I do. So, geopackage? Great. Shapefile? Fine. KML, fine? Let's do a bit of a summary if we're sticking to this 'good company' / 'fastest way to London' thing. This is a bit of a brain dump, and I haven't even been drinking (surprisingly), so please bear with me.
- GeoPackage - reliable new friend. Unlikely to throw a wobbly, even when you're having a meltdown. You've not known them for that long but they've very quickly worked their way up through the roster and are now the go-to for all your mapping needs. Sharp dresser. Good company. Anagram of go page cake.
- Shapefile - reliable old friend that doesn't like own company so always brings their friends along for the ride, and sometimes their cousins too. But you don't mind this because they're pretty easy going, very loyal, and you know that they won't throw a wobbly either. You've heard mean people say bad things about them, and you leap to their defence, but silently and internally because you know in your heart that arguing about geospatial file formats on the internet is a bad idea. First entrant to the GIS File Format Hall of Fame. Certified Legends. The Golden Girls of geospatial (Getty as prj?).
- Geojson - you've not known them that long but they seem okay, even pretty cool. They're always online and are pretty logical. Some of the bigger geojsons move a bit slowly offline, but online they are usually fine. Addicted to the internet though, so don't expect a close relationship.
- KML - our old Google Maps friend. A friend that lots your our non-geo friends like too, and may even know well. Hard not to like, if you're most people. You're never more than 6 degrees from a kml. The Kevin Bacon of geospatial file formats. Is first cousin of someone known as G (ML), who you also know, a little bit.
- NetCDF - a friend that you like but can't understand why your other friends don't seem to like them. Unfairly maligned, though you sometimes wonder if you weren't already friends with them if you'd actually like them if you met them again for the first time. A rumour, almost certainly true, is that netCDF was specifically designed to create geospatial beefs online. But you don't care because they are your pal even if, sometimes, they do weird things.
- GPX - your friend that likes to exercise, post about it online and likes to upload their activity data to social media. But that's fine. It makes them happy and it does no harm. You're not best friends but you know where to find each other if you need to. Wears lots of tight clothes.
- GeoTIFF - loves detail. Loyal. Doesn't like to leave any gaps in a conversation. But they are pretty solid and they don't let you down, unless you forget to invite their friends (Lempel, Ziv and Welch) to the party too. Make that mistake and you can expect a bit of trouble from time to time.
- FlatGeobuf - new friend who you haven't actually spent much time with yet but who you've heard only good things about, from people you trust. It's just that you've got so many other friends and not much free time for another relationship. Has purple hair. You wish you could be this cool, but don't want to admit it. Rides a fixie.
- MapInfo TAB - ah, such happy memories! They live overseas now and you never see them but you remember the good times. A real powerhouse, but kind of retired now, we think. The Stone Cold Steve Austin of geospatial file formats.
- All other geospatial file formats - no longer want to be my friend because a) they are not in the list above and b) they have been lumped together here under a single heading alongside CLEARLY INFERIOR formats. SQLite is thinking of taking legal action because of this blog. MIF is super miffed. DXF is thinking about bespoke wooden furniture and didn't want to be on this list anyway and resents any suggestion of equivalence.
Here's an extract from one of my QGIS training workbooks where I talk about this kind of thing in a more sensible manner, followed by two maps which demonstrate that for most of my use cases the file format thing doesn't matter.
If I don't care too much about file formats then what on earth am I doing writing all this? Well, it's something I deal with pretty much every day and in the course of doing so I see lots of talk about it but in reality I don't find it makes too much difference to me, that's why I tell people who are just learning to use GIS software not to worry too much about it, particularly because QGIS can handle them all very easily. But, having said that, it can all be wildly confusing to people who are new to geospatial and I know this because I do lots of GIS training for people who are very clever and tech-savvy already but who are sometimes baffled by the weird world of geospatial file formats.
Oh, a tip. If you ever get an error in QGIS while exporting to geopackage - as in when it tries to export but just gives you some kind of error message, try
unticking the FID field box on export, so that you're not including that field in the export. This often solves it.
So long as you know that QGIS can export to any geospatial file format anyone would ever need, my view is that a) you don't need to worry about it and b) you should default to geopackage unless you have a really good reason not to (e.g. your org is still a shapefile outfit and not everyone can load geopackages into their software).
So which GIS software is best?
For me, the easy answer is QGIS. It's 20 years old this year and I've been using it for about 9 years. For many others this is also the easy answer. For other people, this is the wrong answer - and that is totally okay. Now that I'm no longer in the higher education world, where I didn't have to think about licences and costs, I don't use ESRI® software any more, but for years I used ArcView and ArcMap and thought they were great, mostly. I even have a soft spot for things like Error 999999 and segmentation violations.
I probably have more of a soft-spot for ArcView 3.2 than anything else, but then again I'm still quite attached to ArcGIS 10, even if I no longer have it on any of my computers. I never did become friends with ArcGIS Pro but that's fine. I'm probably just not much of a ribbon GIS guy. Same goes for MapInfo - it was the first GIS I ever used, more than 20 years ago, and I really loved getting into it. Good times. I also have a copy of Manifold on my computer, and have done a bit of PostGIS in my time too.
Is there a definitive answer for everyone on this question, on which GIS software is best? No, I don't think so. The answer is very much like the 'what's the shortest way to London?' question. It depends upon what company you like, where you're starting from and where you want to go. Although I would say that if you're on a Mac or Linux machine then QGIS is almost certainly what you should use for GIS software if you want to be productive. Is this 'there is no single answer' answer a cop out? I don't think so. The best GIS software is the one that meets your needs most closely, even if it's not actually GIS software.
If you're working in a big org with a long history of using ESRI software (and doing great things with it) then someone saying 'just use QGIS' probably isn't the advice you're looking for - and that's totally logical. But at the same time, QGIS is now mature, robust, powerful software to rival any modern desktop GIS and this was not always the case.
But if I was advising someone who had never used GIS before on which software they should use, I'd 100% for sure say QGIS - I may not have said this ten years ago but in 2022 it's my firm number one and if we look at some basic Google Trends data I think we can see a bit of this in the global data too - although the United States may be a bit different on that front. Again, that's fine, but I do think the landscape is shifting.
You can see this a bit in the Google Trends charts below - first one is Worldwide data and second one is just the United States. Is Trends data any good? Well, I've been working with the Google data team for
years on search data as a proxy for interest -
mainly for elections - and my view is that it's certainly useful for getting a grip on what people search for and what matters most, even if it isn't perfect.
 |
| Worldwide GIS software search trends |
 |
Worldwide GIS software search trends
|
Here's a little looping gif of searches for QGIS (software) and ArcGIS (software) for different countries, and worldwide, from 2004 to 2022. The blue line is QGIS, the red line is ArcGIS. Note the convergence in some countries, the crossover in others, and the large gap in others. The country name is in small text in each chart, just below where it says QGIS - best viewed on a big screen obviously.
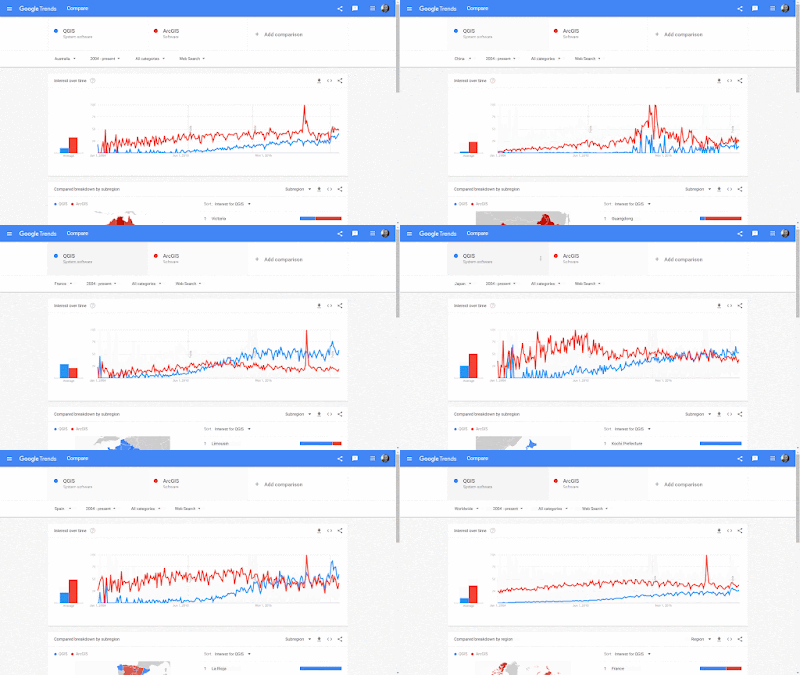 |
| Trends in GIS software search over time, by country |
If the software you use is the one you want to use, does what you need it to, you're happy with it - and you even like using it - then I'd say that's the one for you. If this means using more than one piece of software, even better. Spread the love! For millions of people worldwide this all means that the answer to my initial question in the title is 'ArcGIS is the best software' - although I'd be interested to hear from long-term ArcGIS users on how they feel their transition to Pro has gone.
I must confess that every time I see a new piece of work from the Monet of Maps (
John Nelson) I'm even more tempted to get myself a Pro licence. But there is only so much time in the day and GIS software cannot yet make more of it (unless you can afford to purchase the ArcTime® extension, which gives you 36 hours in each day).
Excel does
maps now too of course, though not incredibly well as far as I am concerned.
So the best GIS software for many people is ArcGIS and/or ArcGIS Pro. I used to use both and deliberately taught both because I think it's important not to become too locked in to one solution. In fact, for a good while I had ArcGIS, MapInfo and QGIS on my main work machine, but no longer - today it's just QGIS.
Because I think QGIS is the best GIS software for me, here are some of the best things about QGIS for me, followed by something I'd change about QGIS.
The best things about QGIS
There are lots of great things about QGIS, but I can probably highlight a few here for anyone thinking of getting into GIS software but not totally sure about what one to choose.
- Works on any operating system - Windows, Mac, Linux (and I have it installed on each of these operating systems, and previously had it on my Chromebook too)
- You can make GREAT maps with it, just like the newsrooms of major global media organisations do (e.g. New York Times, Washington Post, BBC, the FT, and so many more)
- It can handle any geospatial file format
- It can export to any geospatial file format
- I can automate the mapping process with QGIS Atlas and output thousands of different maps at the click of a button
- I can get all fancy with expressions, filters, queries and little bit of code and combine it all to create lovely maps
- It's already great but keeps getting better
- Cartographically it's a powerhouse - so many options and shortcuts mean it's super-efficient
- The Print Layout (which can seem fiddly at first) is super-powerful and adaptable
- The Processing Toolbox - an absolute powerhouse of geoprocessing
- Plugins - because it's open source we have so many great extensions developed by people across the world
- Python integration - I'm still terrible at all this but click the Python Console button and you can go far
- The user community - this is not niche orphan software, QGIS is a huge collective of users and developers
- It's super-easy to add web map layers to QGIS (e.g. XYZ or WMTS format or suchlike) - this is so useful
- Your niche problems are often solved before you even knew you had them - this is because someone else probably had that problem first and then either a) created a Plugin to solve the problem or b) wrote a tutorial to help you and the rest of the world solve the problem - this can happen super-quickly in open source software in a way that it cannot always happen for proprietary tools
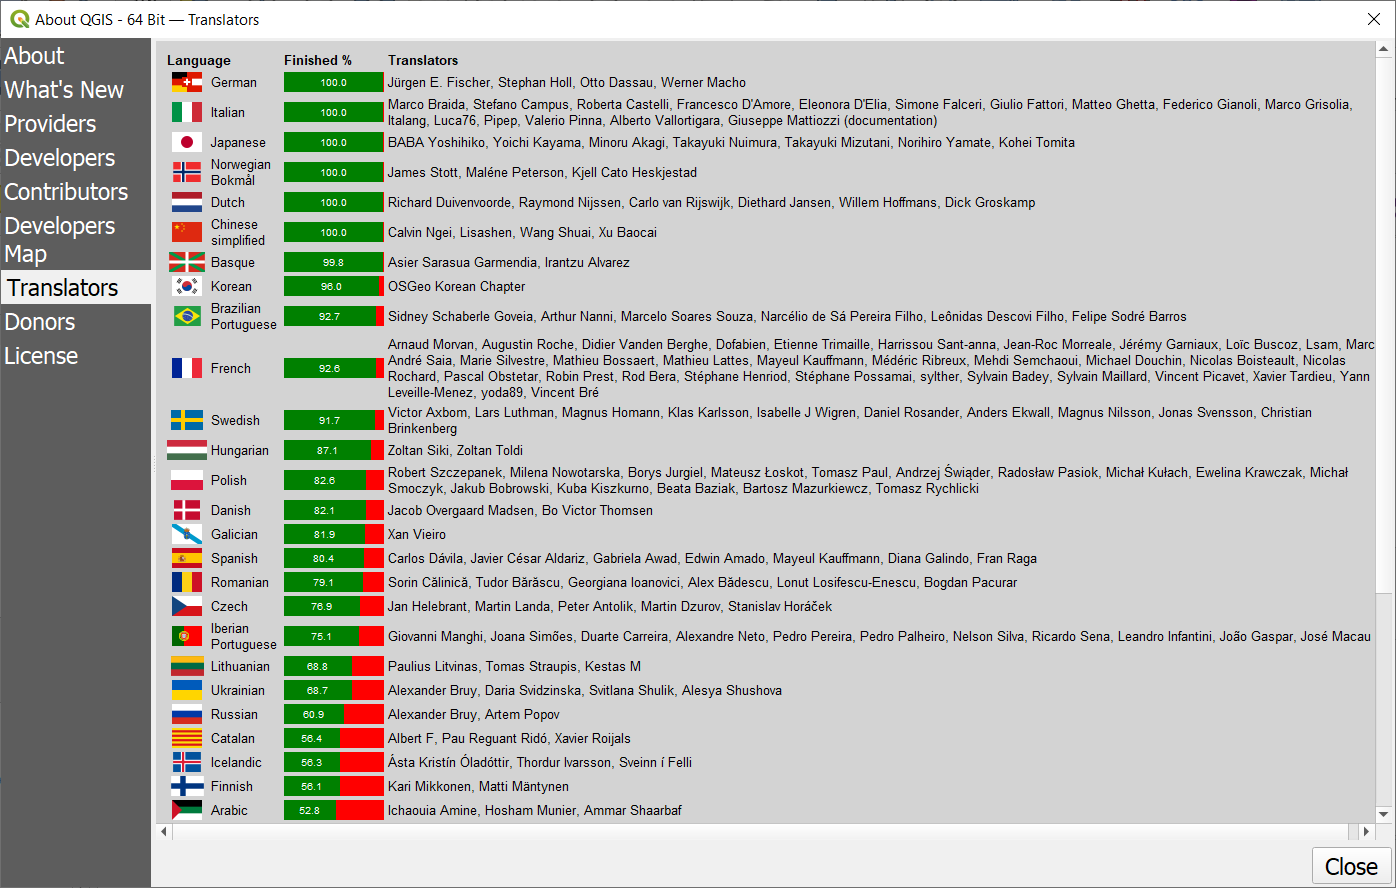
- Multi-language support - you can use QGIS in so many different languages, thanks to the international nature of the user and developer community (see below)
- It's free - this is WAY down the list of reasons for me, because I don't mind paying for good software and I donate to the QGIS project anyway (currently at least £500/year but hopefully over £1000/year soon)
 |
| Klingon? Not yet |
What might I change about QGIS?
No software is perfect, even if it is (cliché alert) perfect for you. In fact, I believe nearly all software is very far from perfect, but some come close. So, with this in mind, here are all the things about QGIS that I would change, if I could.
- Fewer updates - I saw a post on Twitter commenting on QGIS that it was software 'by devs, for devs' or something like that and while I don't agree I can at the same time see where this view comes from and have some sympathy for it. And anyway it does no harm to think about these things.
That's it really. There are small things I'd tweak due to my own personal tastes if the software was only being used by me, but from the perspective of a trainer and something of a cheerleader for QGIS I would perhaps like to see a two to three yearly long term release (LTR) schedule and if the regular development versions (release candidates) are still made available (but given much less prominence on the download page) that might be good for new users and even more established users like me. I have had a lot of feedback from users when installing that the LTR vs RC thing can be confusing, as difficult as this may be to believe for those well-versed in the software.
This 'fewer updates' desire is a bit like the job interview question where you're asked if you have any faults and you reply that 'I work too hard and am such a perfectionist' because it's basically a positive disguised as a negative in that I install and enjoy the frequent updates but at the same time the timetable does make my head spin sometimes.
Overall, though, I mainly want to thank the large and generous QGIS development team for what they have produced since Gary Sherman's initial release in July 2002. It really is remarkable that QGIS has reached the point where we have millions of users, across all types of organisation and national contexts and for many people across the world QGIS is now their desktop GIS of choice, and good company too.
I try to contribute to QGIS myself by being a sustaining member (£$), by offering free tutorials on my blog, helping people via email and DMs, as well as offering training to individuals and companies. The plan is to move up to the next financial category of sustaining membership, and hopefully that will happen soon.
But what about making maps in R, Python and suchlike?
A good question, but not one I really mean to get into here because I'm talking about software specifically for GIS. But of course R and Python are great tools for map making, as well as lots of other things. And what about tools like Mapbox, CARTO, UrbanSDK, Felt and so on? Again, all great but these are not desktop GIS software, which is what I'm talking about here. I've used them all to varying degrees and had lots of fun doing so, but I remain rubbish at R and Python. But here's my Greggs steak bake spider map anyway (info page).
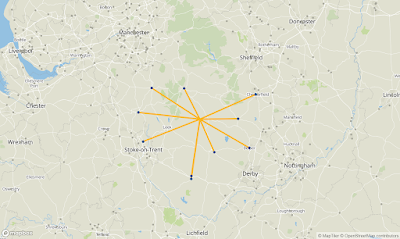 |
| Where is the nearest Greggs? |
Final thoughts
"Which GIS software is best?" This is actually the second question, or even the third or fourth. The first question is "what do you need to do?", the second is "what do you need to do it on?" and the third might be "in what setting or context?".
I tried not to go too hard on the 'QGIS is amazing' vibe here, and I probably failed. But I do hope that readers who have come this far will take my point that 'best' is very much context-dependent and that the solution for one person may not be the same as it is for another. And that is totally fine.
Oh, and the shortest way to London on land is 8h 46m on the Inverness to London King's Cross train from 07:55 to 16:41 or a 1h20 flight if you want to mess around in airports for half a day and then find your way into central London.
Just make sure you don't sit next to someone talking about GIS software or geospatial file formats because that would make it THE LONGEST JOURNEY ON EARTH.
Notes
®Esri, ArcGIS Pro, ArcGIS Online, ArcPad, Web AppBuilder, ModelBuilder, ArcMap and ArcGIS are trademarks, registered trademarks, or service marks of Esri in the United States, the European Community, or certain other jurisdictions.
The Trends data is pretty interesting, but don't take it as hard evidence that x is more popular than y. Having said that, the difference between the red line and the blue line in the US chart is maybe indicative of a situation of actual ESRI market dominance on the ground. Who knows though because it's difficult to get reliable data on the desktop GIS market.