
Over the past few decades, UK universities and other higher education institutions have been subject to an assessment of their research quality through something called the Research Assessment Exercise (RAE) and more recently the Research Excellence Framework (REF). When I got an academic job at the University of Sheffield in 2008, it was probably because my last name is Rae and the year was 2008 and they thought I'd be good for their RAE2008 profile. Anyway, I left my academic job a couple of years ago and now run my own spatial data and training company but I did have one eye on the REF2021 results because some of my work was in it (papers, plus an impact case study).
 |
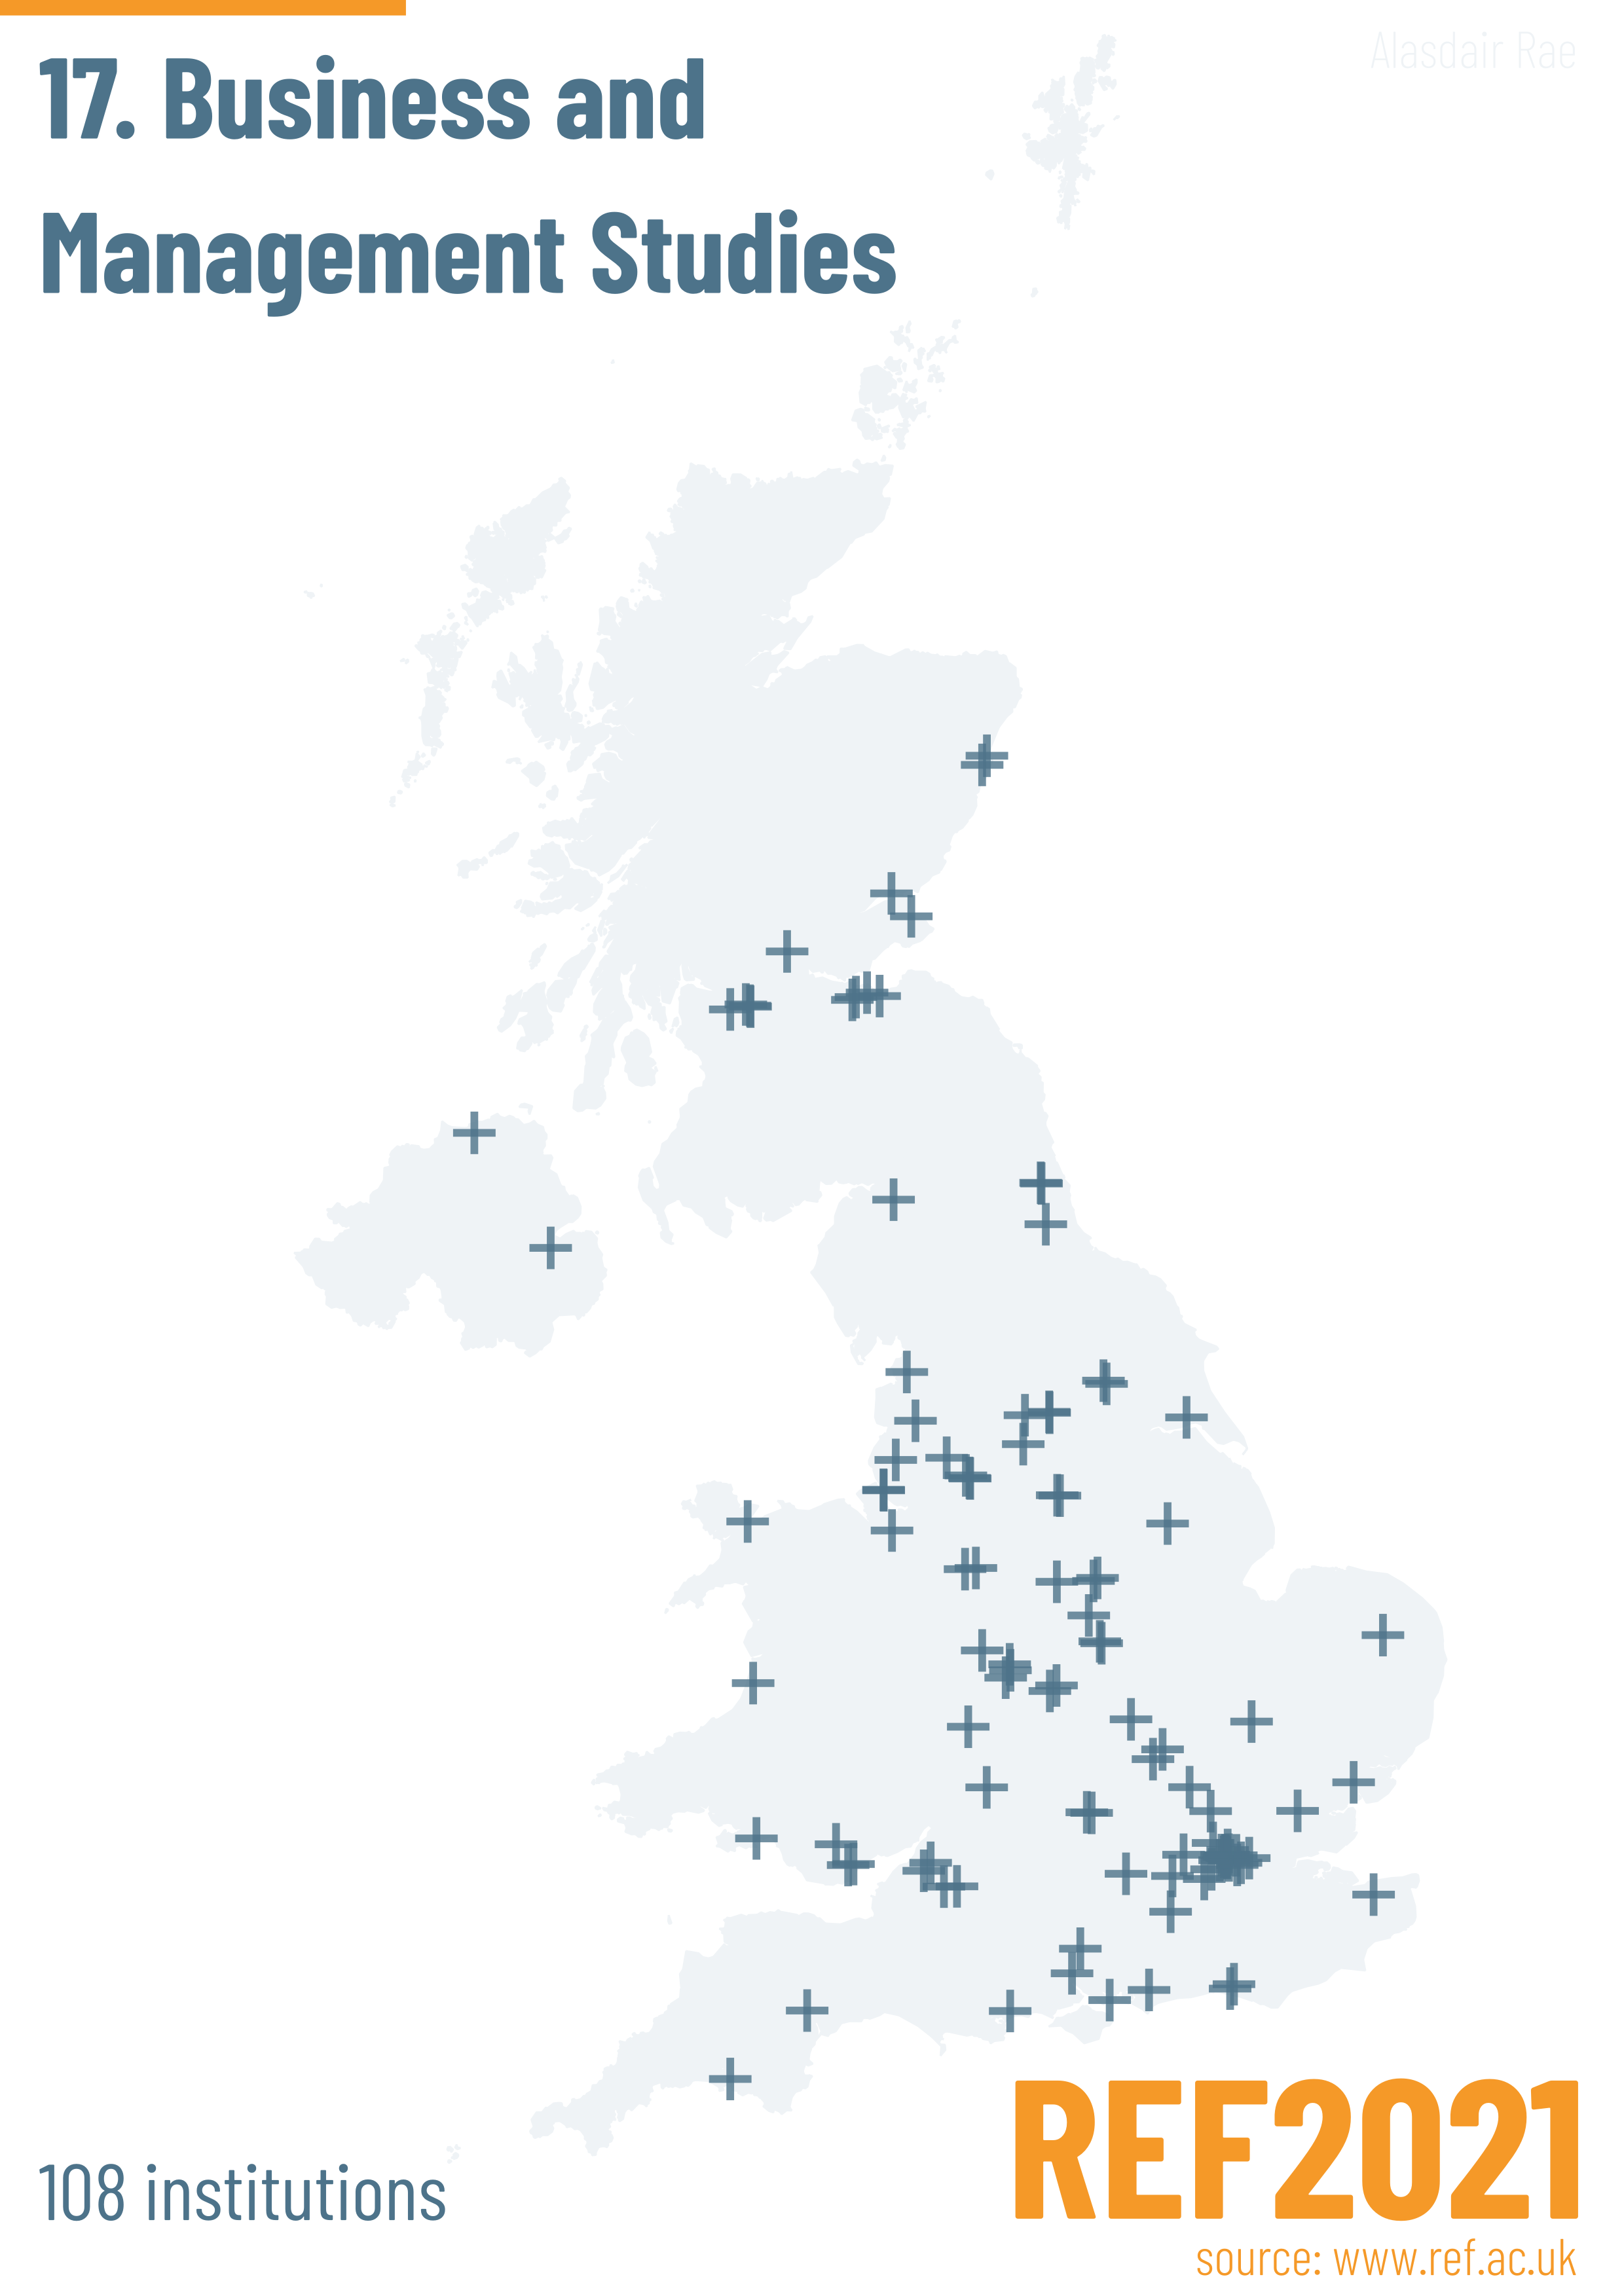
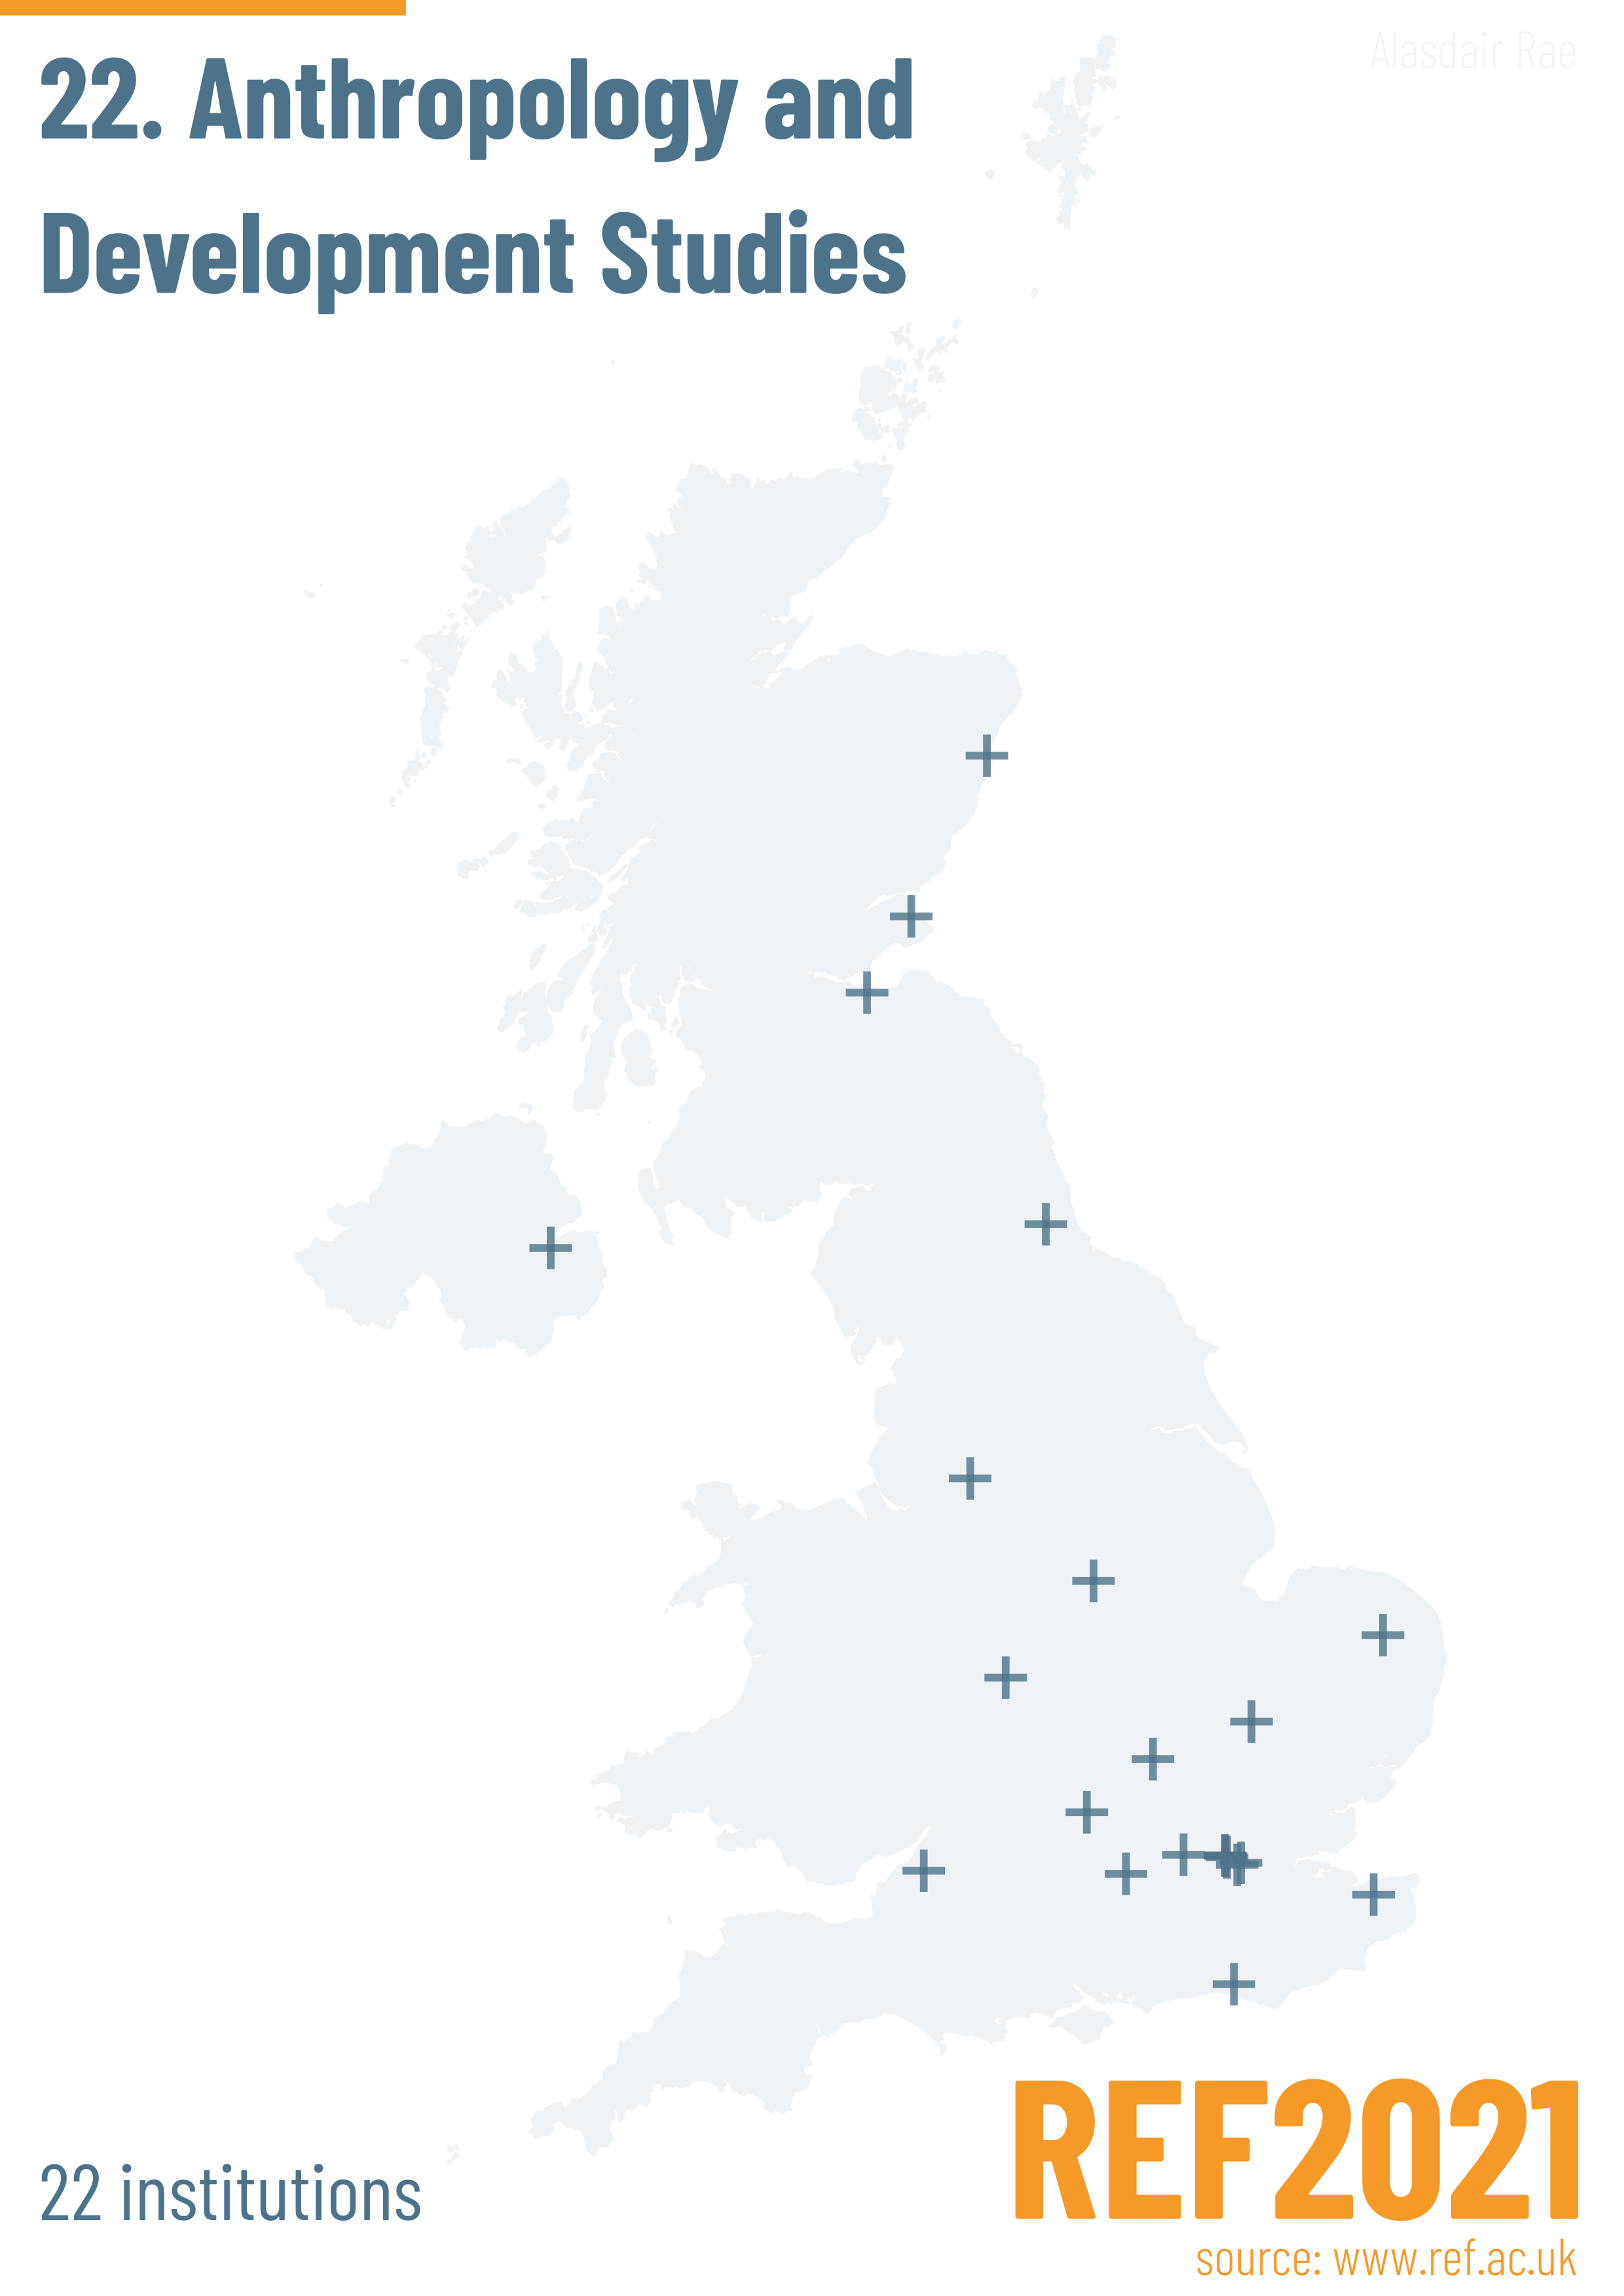
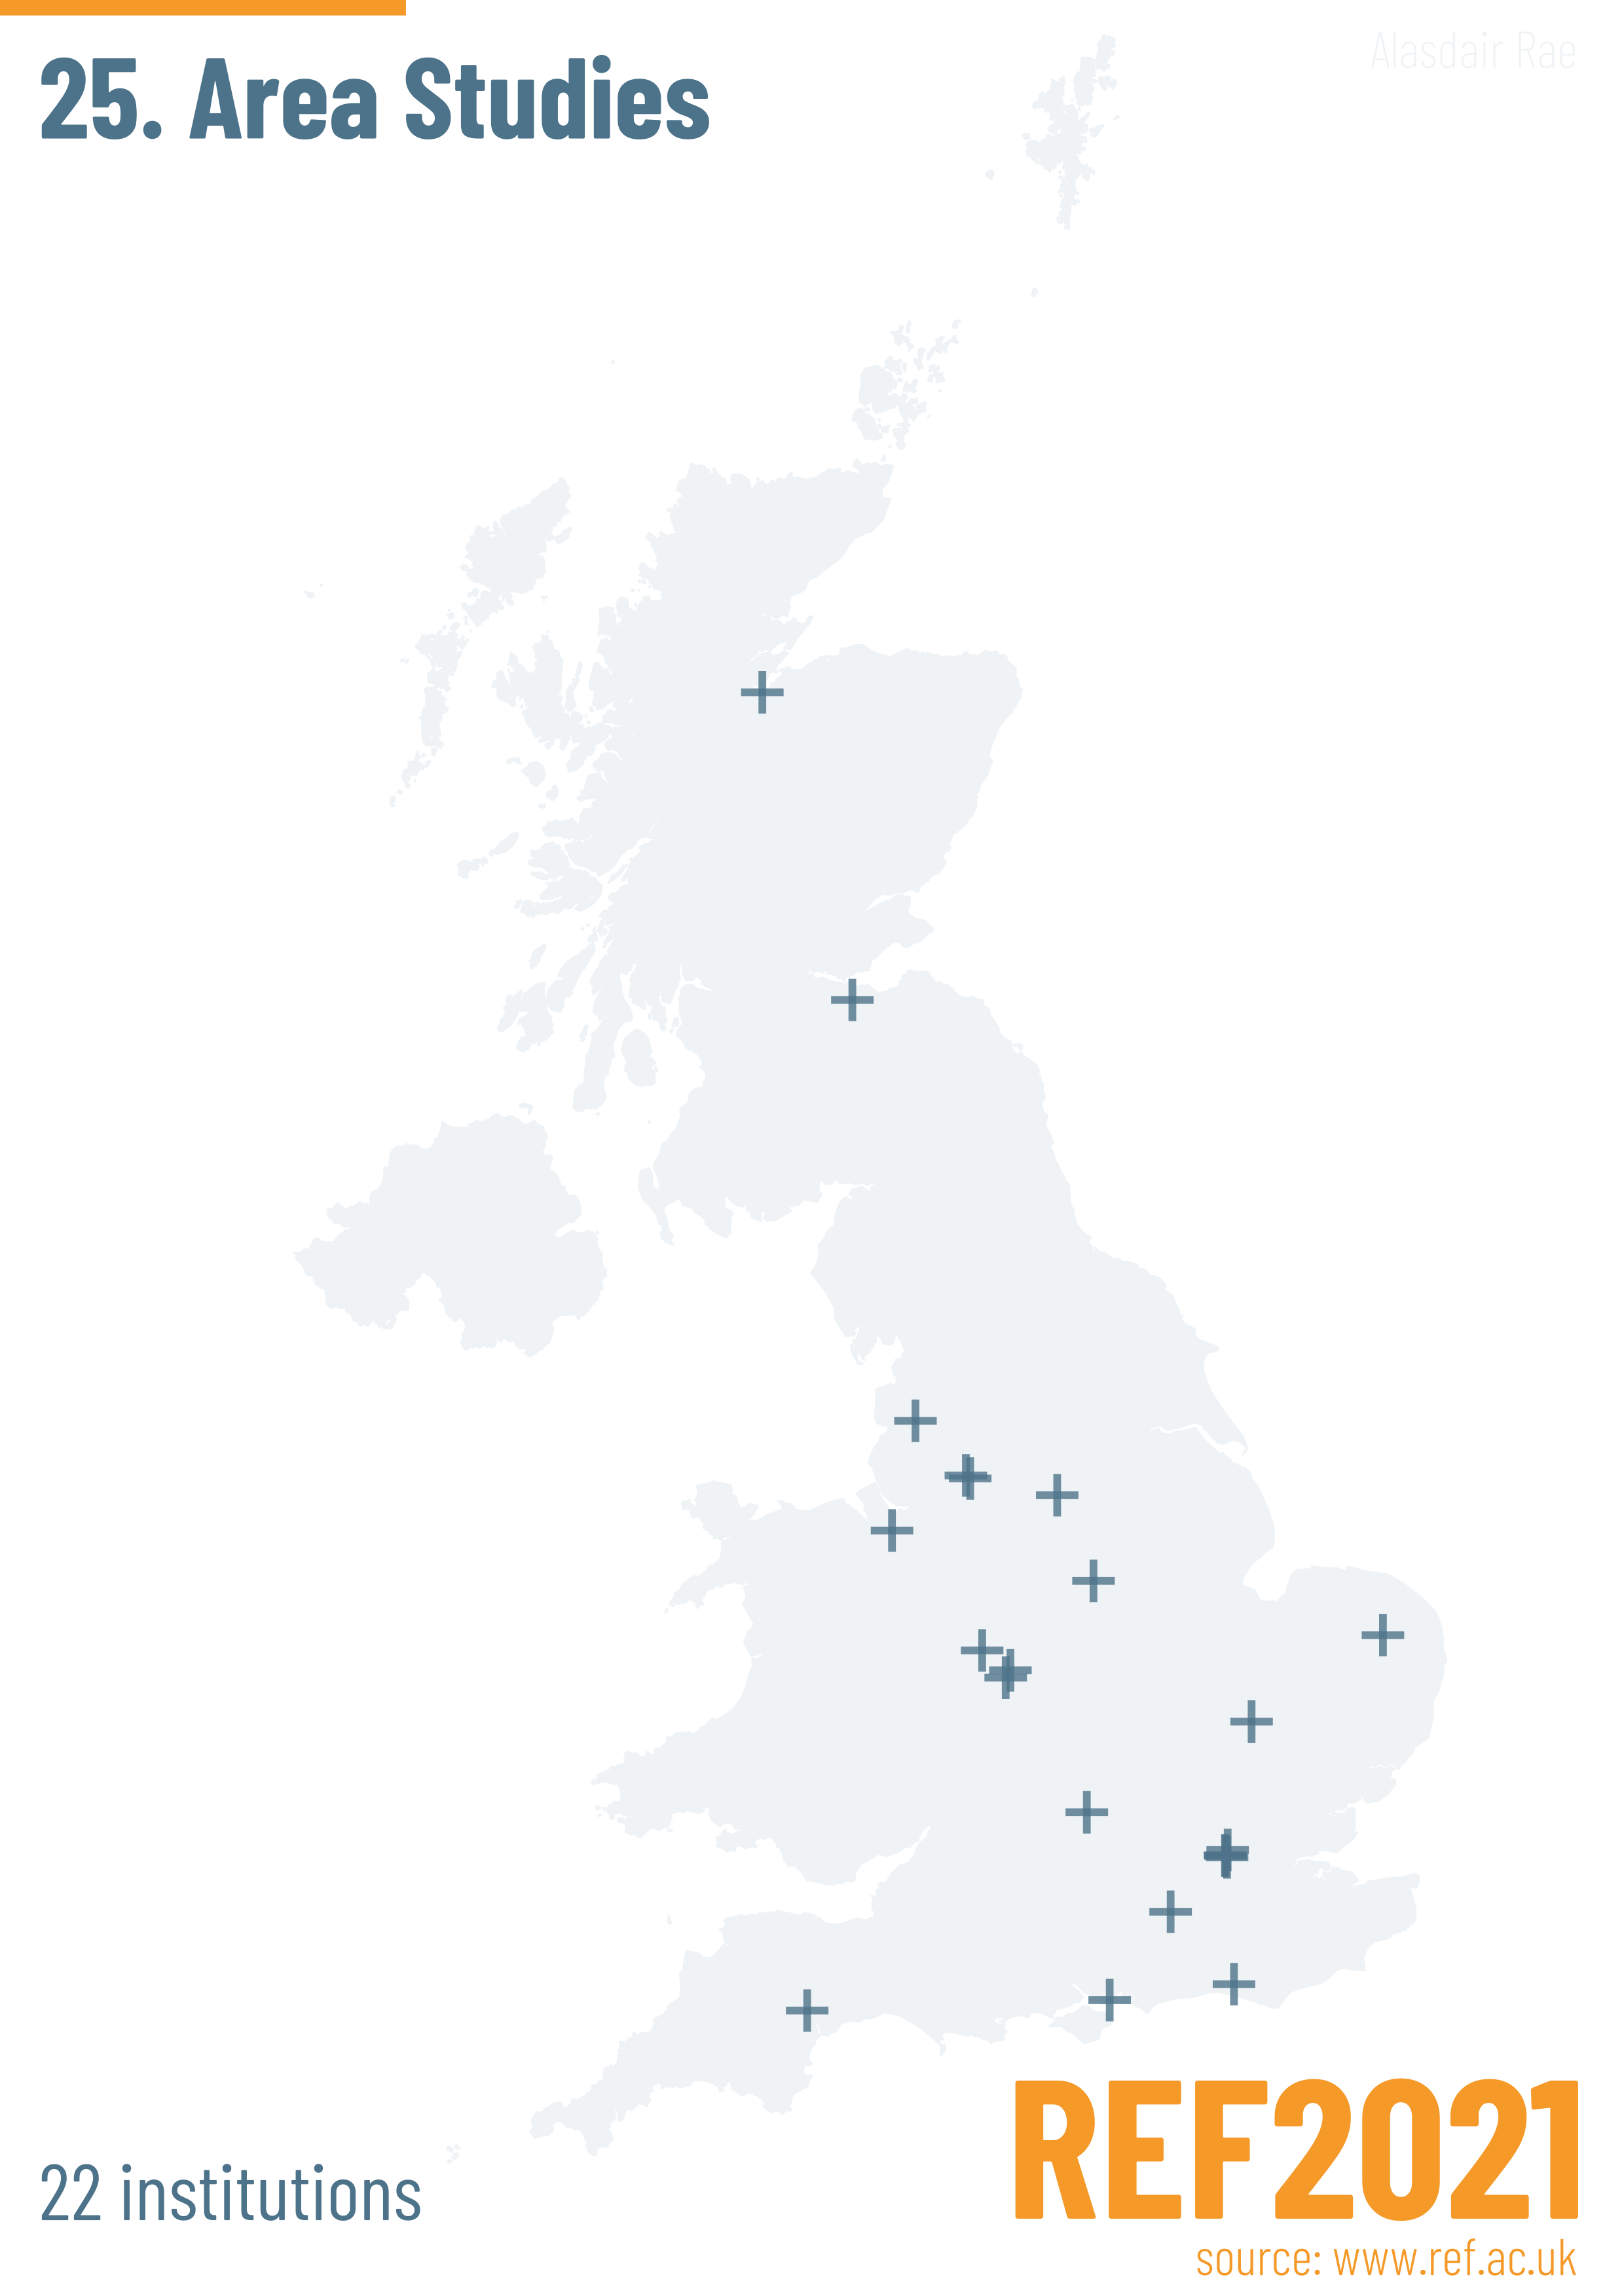
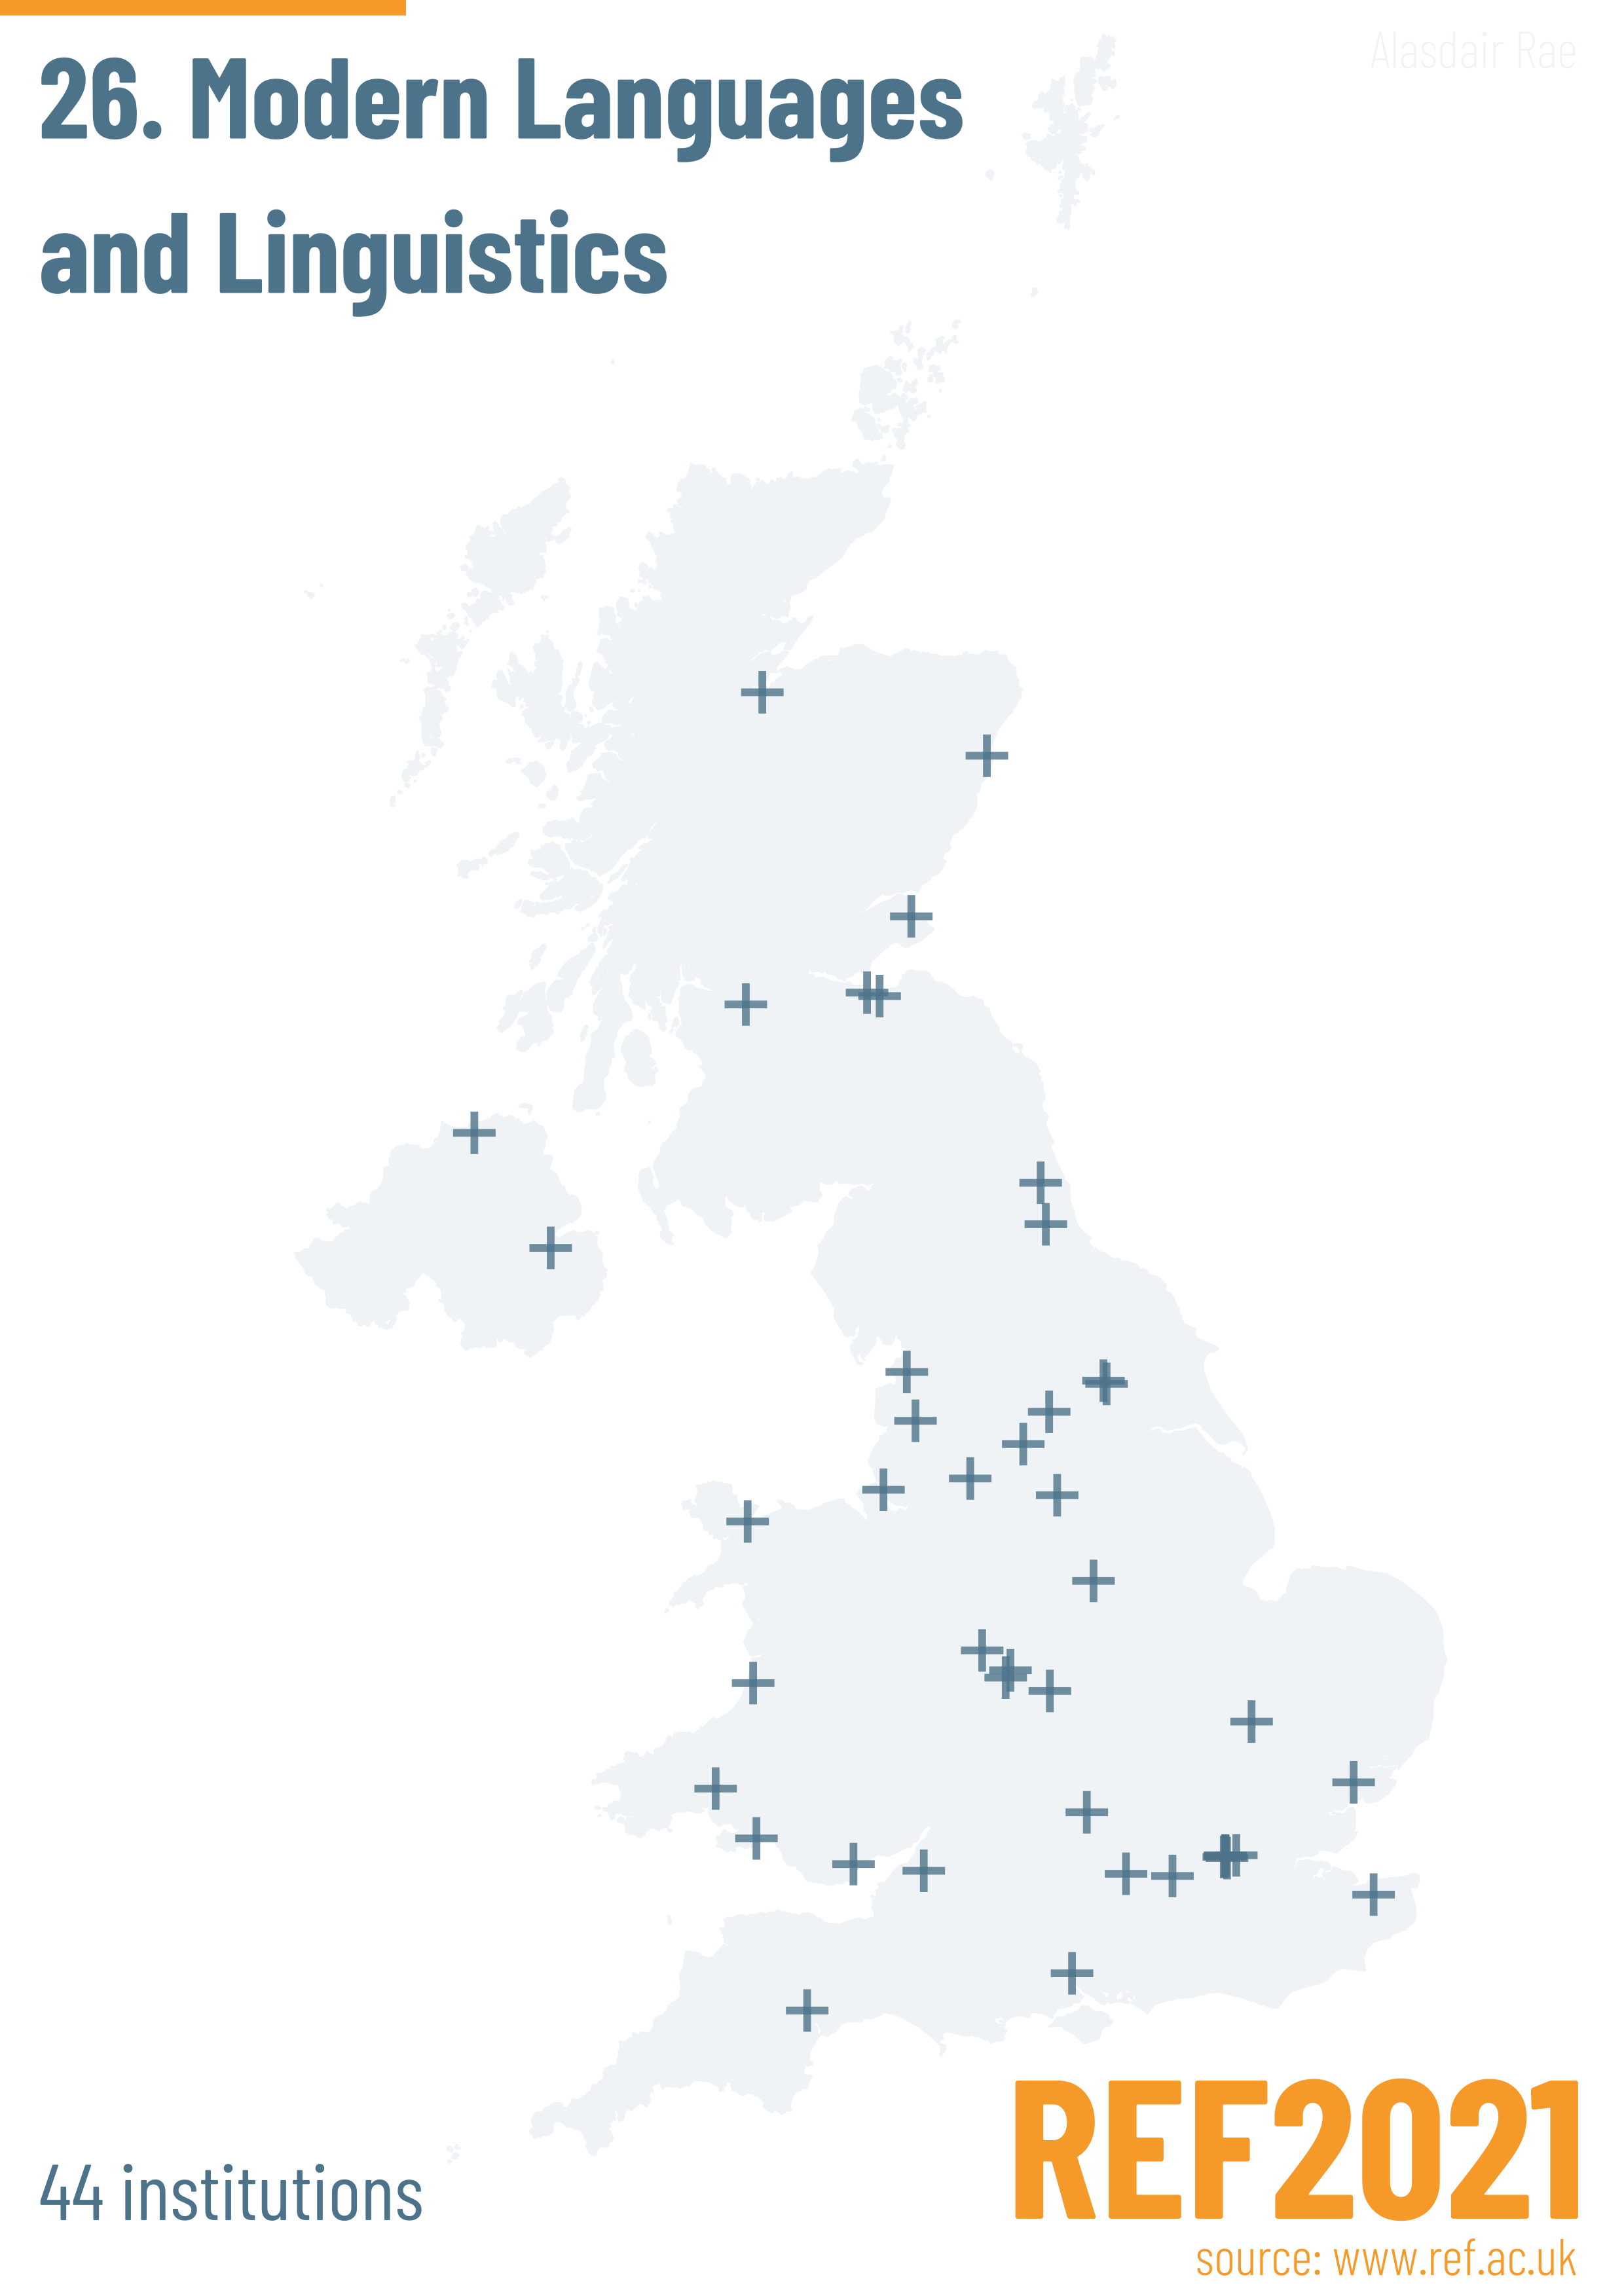
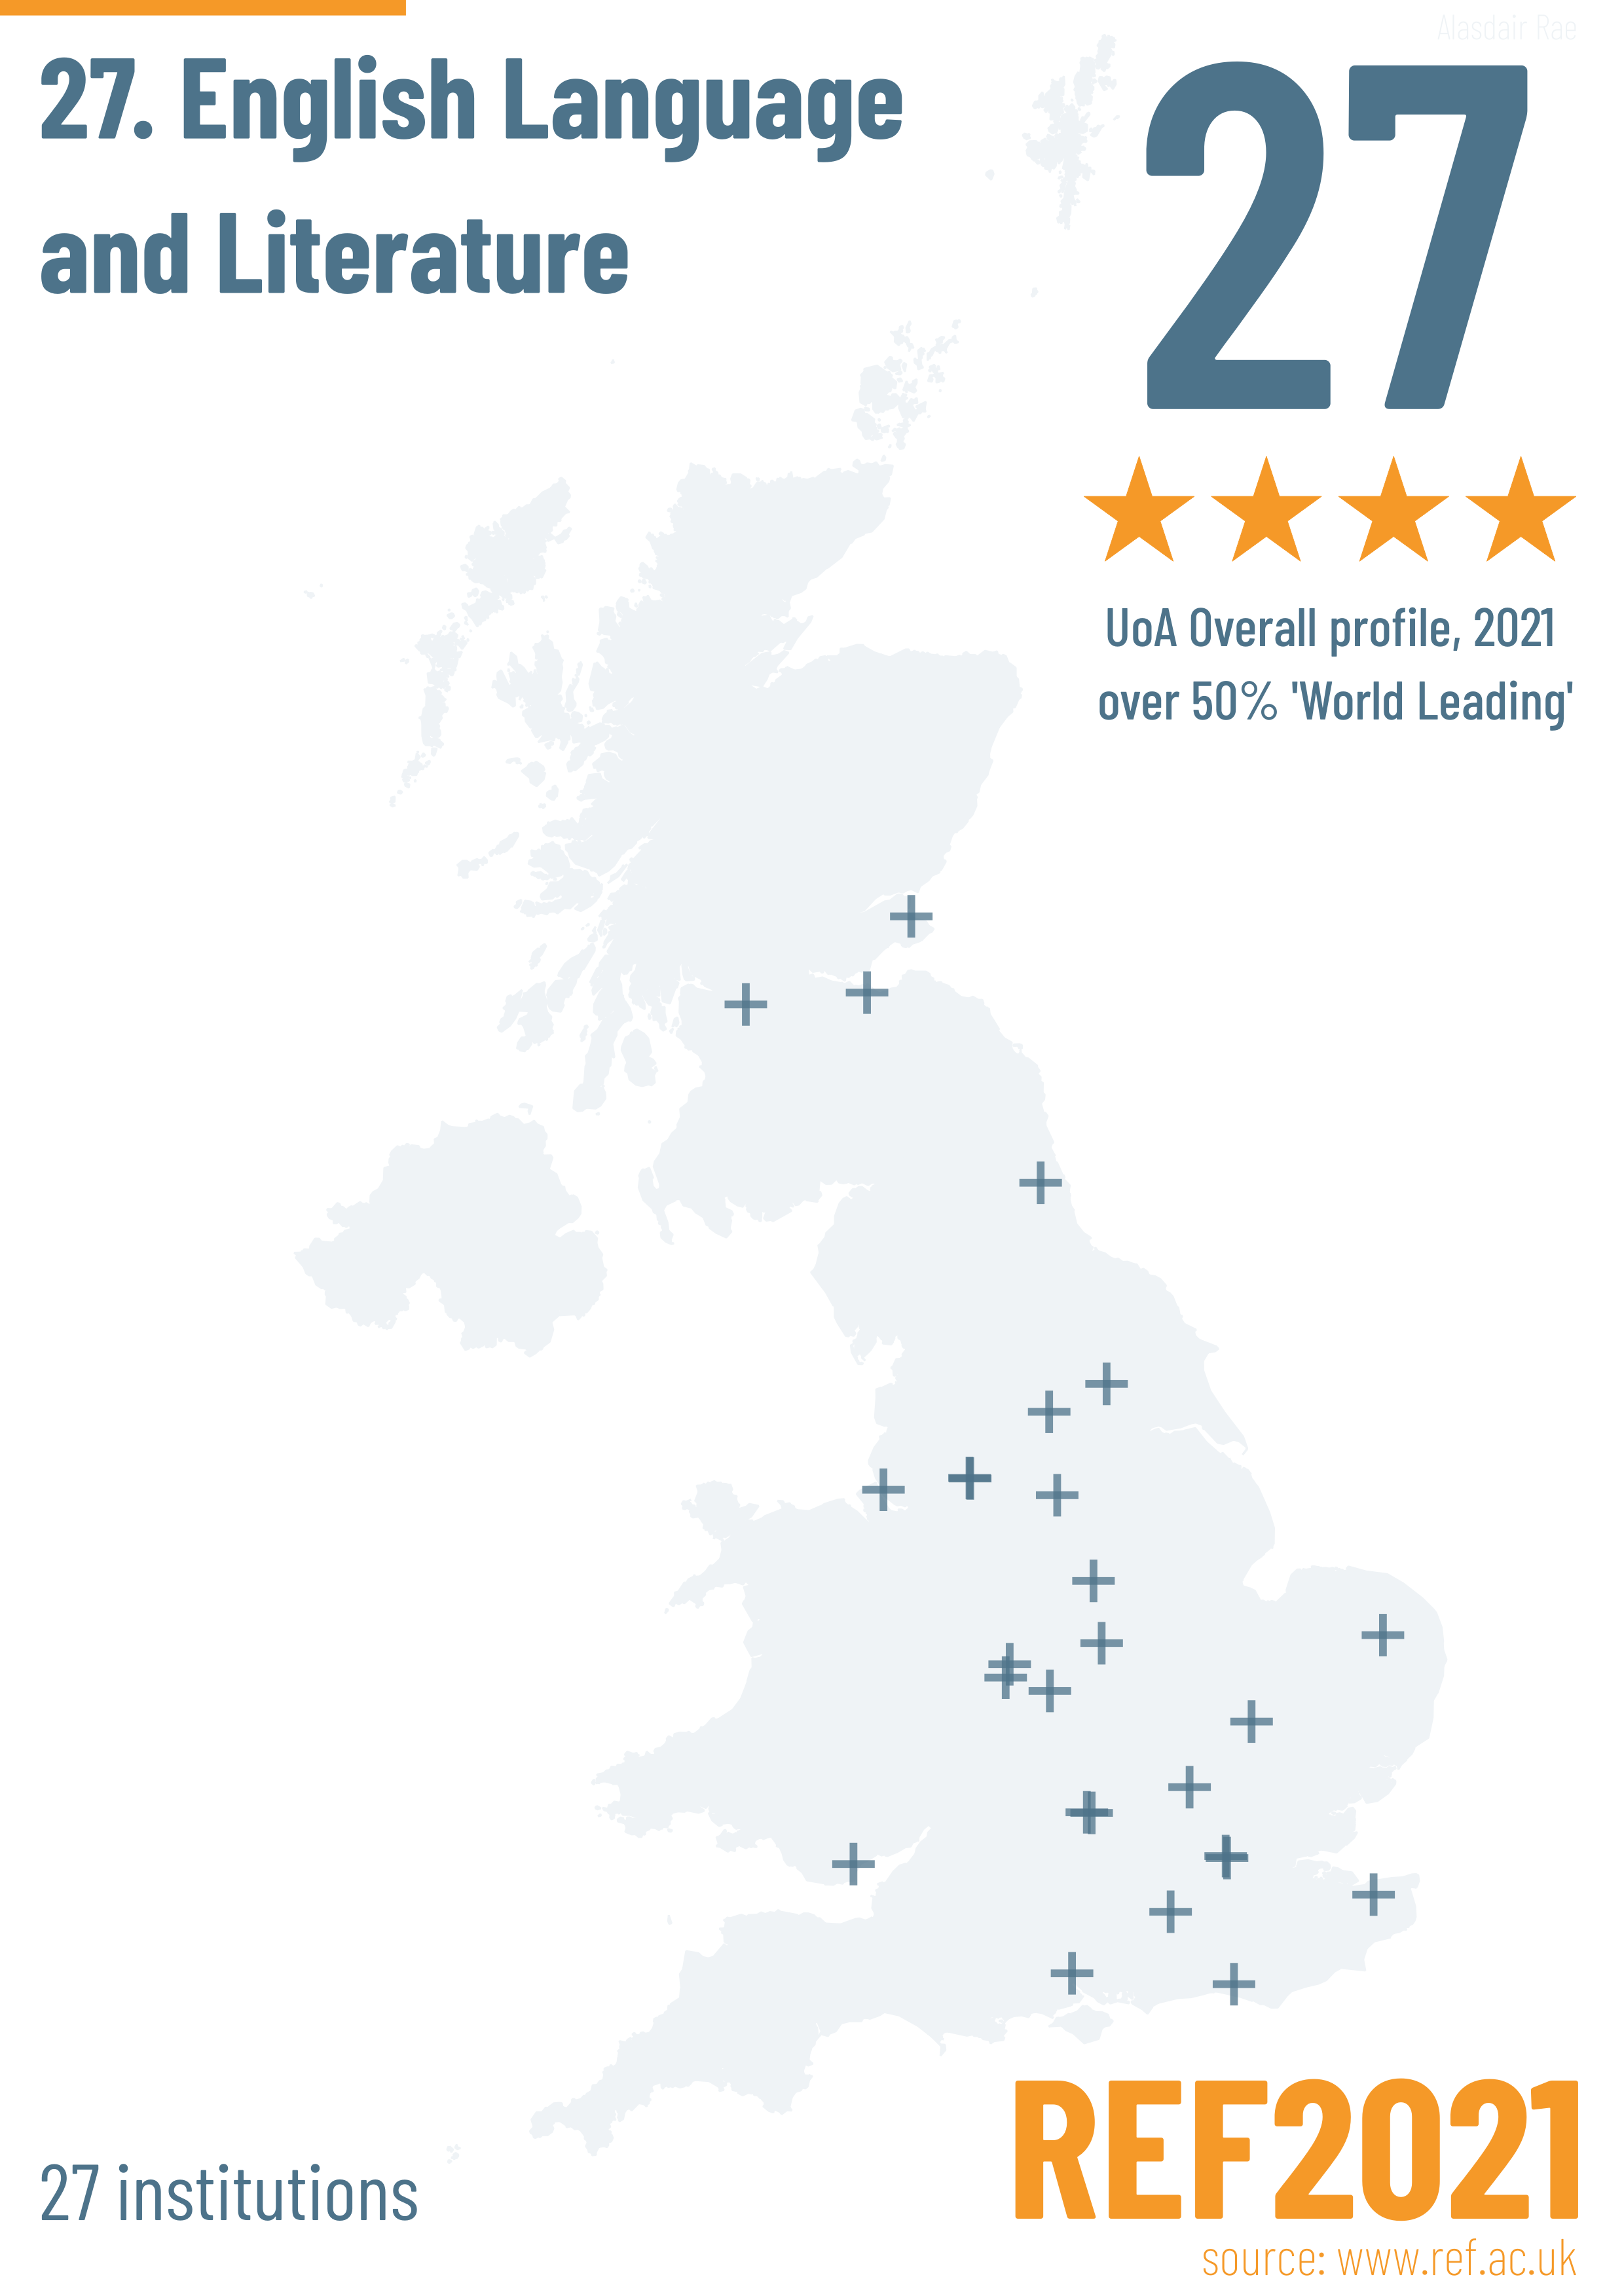
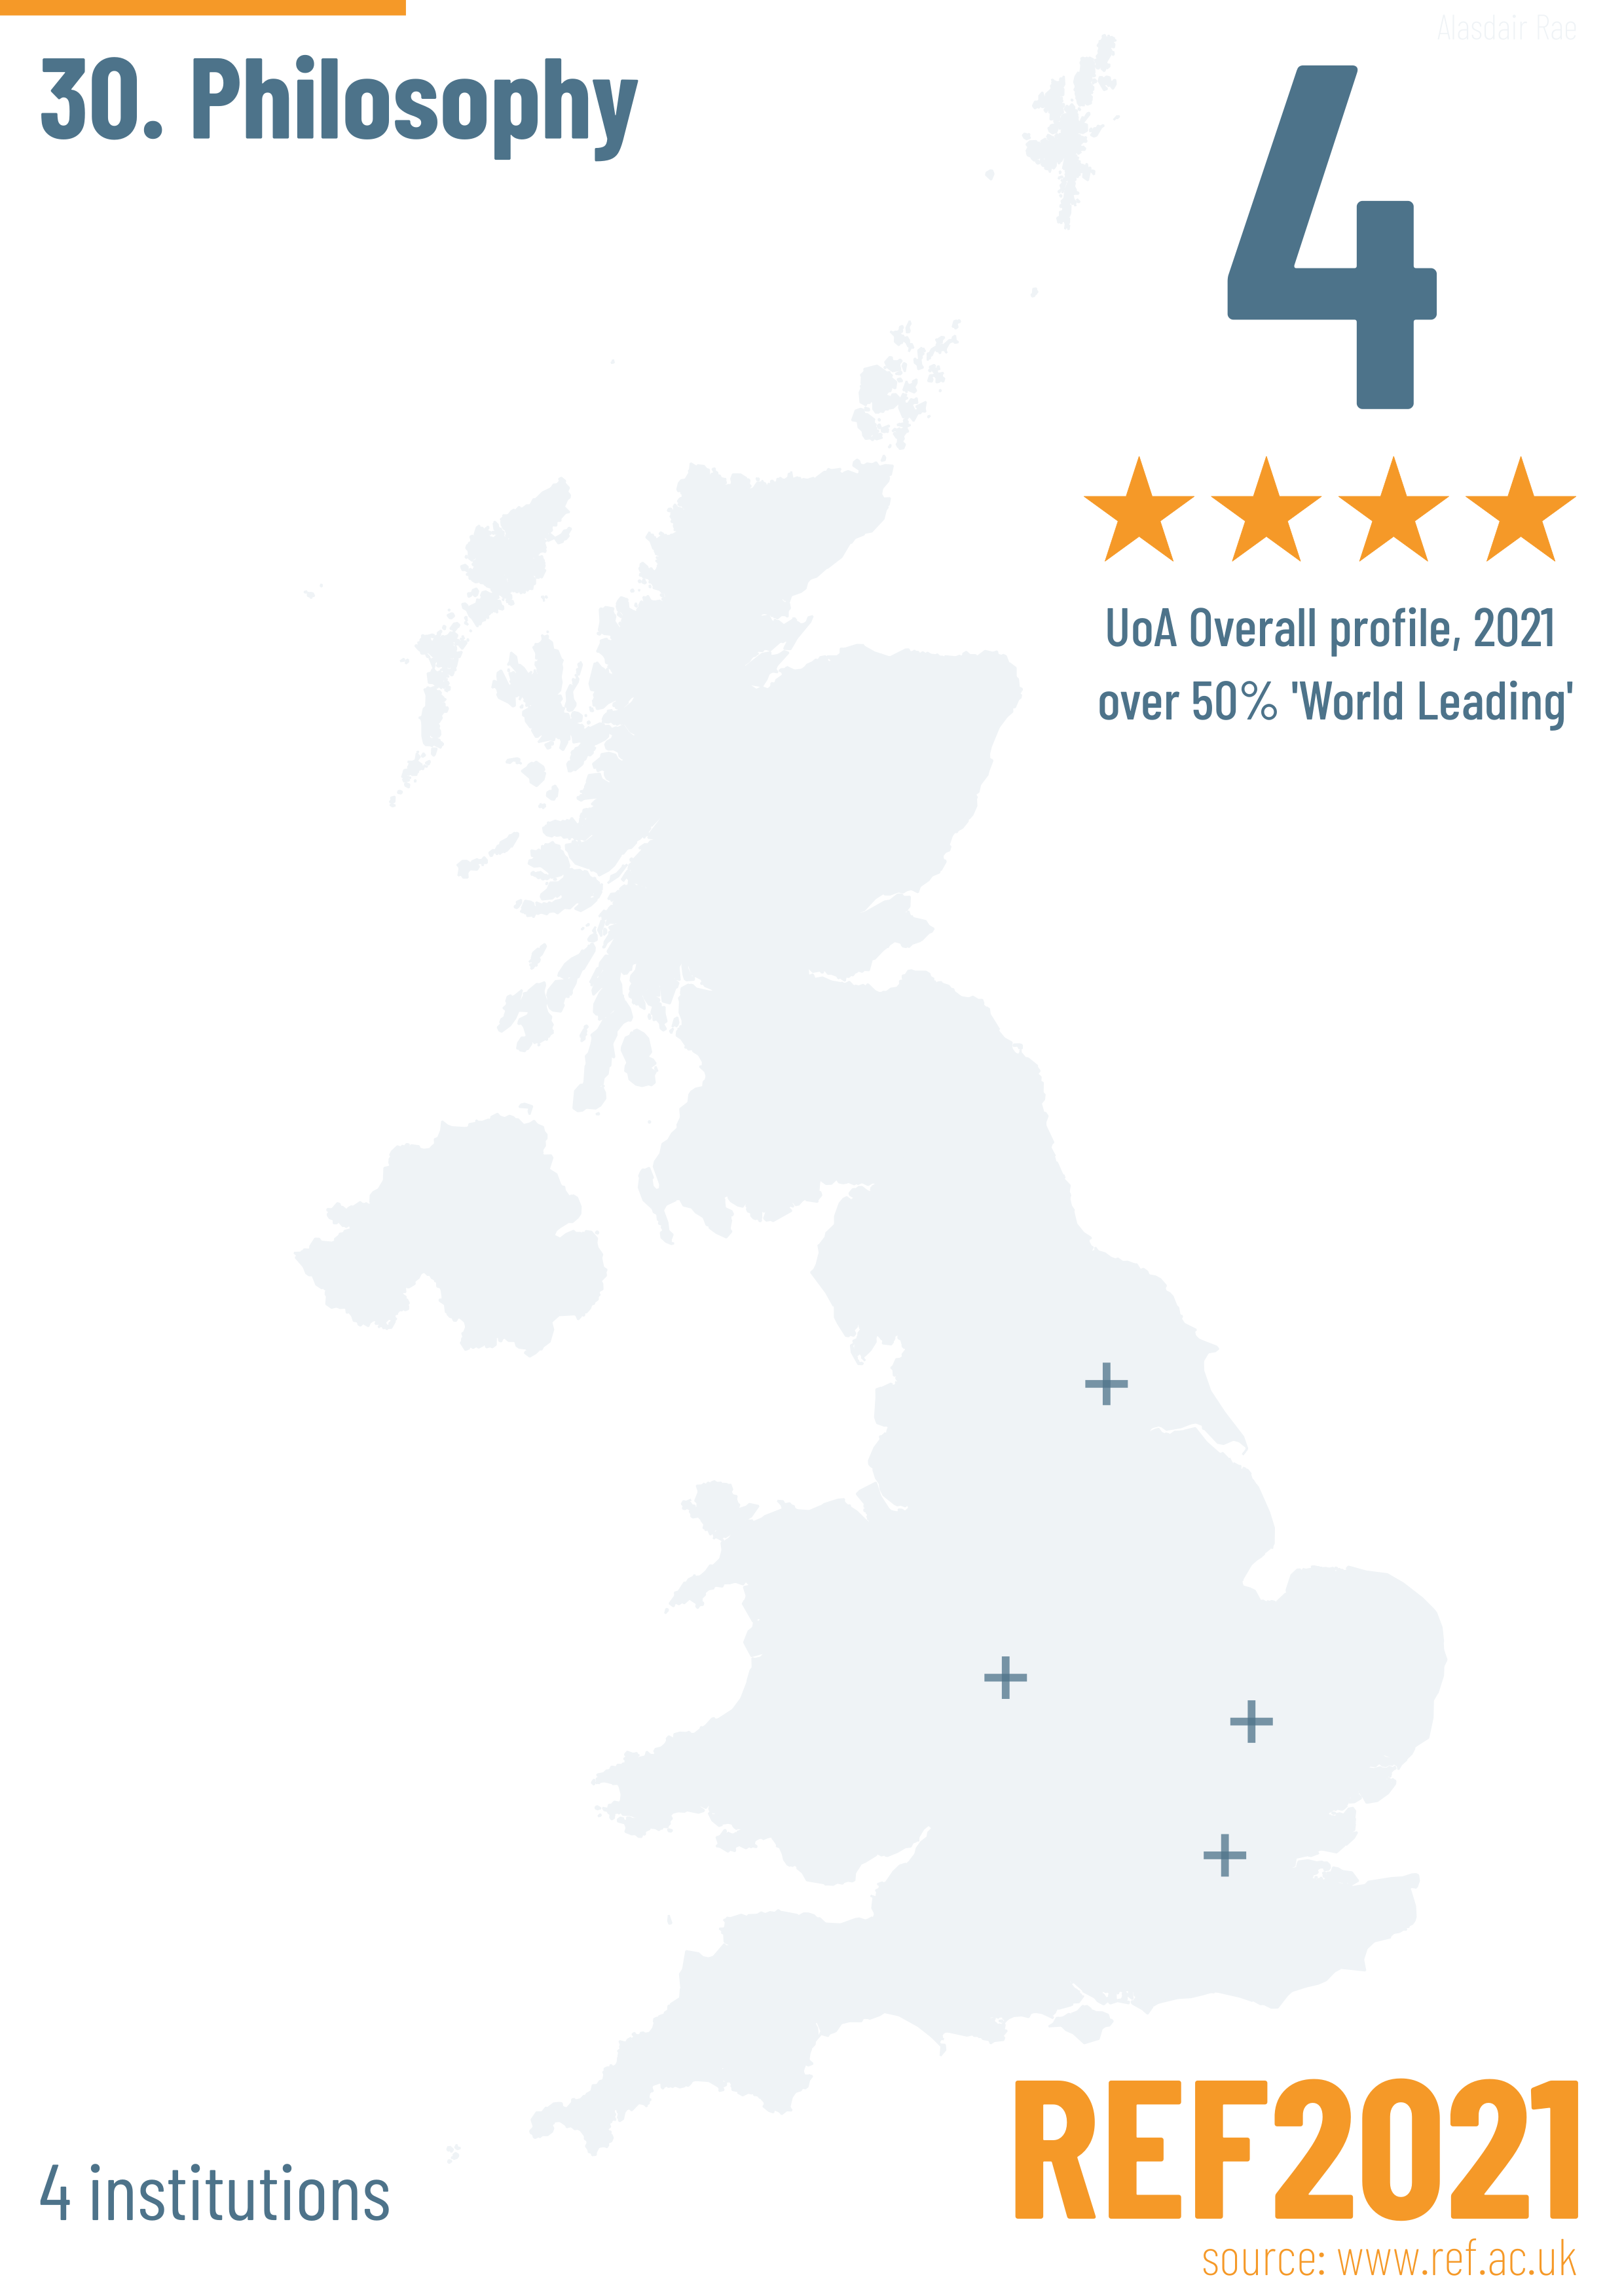
A lot can and has been said about REF, good and bad (okay, mostly bad), but here I'm taking a brief look at the geography of the results, by the 34 units of assessment (UoA). Here's what you'll find below.
- Maps showing the basic geography of each UoA.
- Maps showing where the top ranked institutions in each UoA are.
- The number of REF institutions by local authority (that's the preview image above).
But before we get going, here's the general overview showing the size of each institution's REF2021 submission in terms of staff numbers (and remember that in most cases the total % of academic staff submitted is less than the total number working at any individual university).
 |
| Lots of big blobs here |
As always, click on an image to see it full size and if you want to use any of these images, just go ahead, no need to get in touch. I've added a few technical notes at the very bottom of the post. Now, click a map, then flick through the images - there are lots of them.
The basic geography of REF2021


Top ranked institutions, by UoA


Institutions by local authority
 |
| I was just curious about this |
 |
| I didn't quite realise how many there were here |
Notes: the source for this is the official spreadsheet published on the REF2021 results page on 12 May 2022. For most institutions (mainly Universities of course, but some are not - e.g. The Institute of Zoology, The Royal Academy of Music) the location is fairly clear-cut but bear in mind that some institutions can be spread out over different locations, sometimes far apart - as in the case of the University of the Highlands and Islands with the HQ in Inverness but colleges spread throughout the region. What does 4* mean, anyway? Good question. Here, it just means that the REF panel decided that's what it was, so that's what is on the map. Sometimes the number of institutions or UoAs you see on a map may not exactly match what you may find in your own calculations, depending upon how you do them - this would be due to joint submissions from multiple institutions. Spotted an error? Feel free to let me know. Hate REF? I understand.