Showing posts with label hex. Show all posts

Thursday, 13 July 2023

A new UK constituency hex map

There are new constituency boundaries in the UK so we made a new hex map. This means that the ones used in previous elections have been replaced by a new set. There are still 650 constituencies but they are in many cases quite different so any election boffins/mappers will need to get used to them, and their new shapes and names, pretty quickly. Take a look at this interactive map if you want to compare them (will load slowly, is best on big screen). When is the next UK general election? Well, nobody knows the date but it has to be no later than 28 January 2025. Philip Brown and I knew all this was in progress because we keep track of these things - particularly Philip - so many months ago we began the process of creating a new hex map, which you can see below. After that I say a bit more about the process of putting this together. Here's the direct link to the geo files if you want a shp, gpkg or geojson of the new hex map. Don't like hexagons? See this new video on my channel for how to change them to other shapes.


The new hexmap - web version


Search constituencies by name

A bit of preamable

You can make these things automatically, programmatically, algorithmically etc etc but the results will normally be very sub-optimal. Why? It's because of the difficulty of putting the hexagons together in a 'least-worst' configuration. They are all in the wrong place, but some are less wrong than others. That is, hex maps are about portraying each area with a shape covering the same area rather than geographical accuracy. 

Why? Because sometimes we want to size things by population rather than land area, but this means we have to sacrifice overall shape and individual area locations. But you probably already know all about this if you're reading my blog.

Each constituency has (very roughly, and with a few notable exceptions) a fairly similar population. Here's what the Parliamentary Constituencies Act 2020 says about it.

The Act sets out a number of Rules in Schedule 2 which are relevant to the detailed development of proposals for individual constituencies. Foremost among these is Rule 2, which provides that – apart from five specified exceptions – every constituency we recommend must have an electorate (as at 2 March 2020) that is no less than 95% and no more than 105% of the ‘UK electoral quota’. The UK electoral quota for the 2023 Review is, to the nearest whole number, 73,393.

Accordingly, every recommended constituency (except the five ‘protected’ constituencies) must have an electorate as at 2 March 2020 that is no smaller than 69,724 and no larger than 77,062.


The four Boundary Commissions in the UK published their new electoral maps (after previously publishing the initial proposals) in June 2023 and then we finalised the process. There are a total of 650 constituencies, just like before, with the following number in each country of the UK.

  • England (543)
  • Northern Ireland (18)
  • Scotland (57)
  • Wales (32)


The process of making this hex map

The process of making the map involved the following things, with me proposing the idea to Philip initially because he's really an electoral genius with boundary knowledge that quite frankly I'm surprised can be contained in just one brain. Anyway, he took up the task and got to work and we have our initial 'final' set - though as you can see from the web map url we consider this a 'beta' release because we're very aware that we are capable of making mistakes, even if we did go through a fairly rigorous quality assurance process!

Okay, so here's what we did. Then below that you'll see some images of how this all worked, including a few WhatsApp screenshots as proof of the level of thought behind this (and probably also evidence that we may need new hobbies).

Here's how we did this
  1. Meet at Dunkin Donuts many months ago to discuss doing this.
  2. Create blank hex grid in QGIS.
  3. Agree that we should start with final shape in mind.
  4. Agree that out of all previous UK constituency hex maps Ben Flanagan's (Esri UK) shape was the best shape, so model ours on that.
  5. Agree that we should generate a unique three letter code for each hex - so that (e.g.) we can label each hex within the shape and because official names often too long!
  6. Get loads of sheets of A2 and A3 paper printed with blank hex grids on them.
  7. Leave Philip to do his thing.
  8. Meet to discuss from time to time.
  9. Let Philip get on with it, region by region (England) and then UK countries.
  10. Monitor initial proposals from Boundary Commissions.
  11. Come up with final configurations on paper.
  12. Spend day working together on converting paper into digital.
  13. Revise, tweak, move a few polygons, re-shape Northern Ireland, move things around a little bit.
  14. Check for errors, duplicates, typos, and suchlike.
  15. Check again, then generate geo files for sharing (shp, gpkg, gejoson).
  16. Make web map available, as well as file repo.
  17. Add ONS area codes as soon as they become available (not sure when this will be).

That is more or less it, but it took many months and most of the hard work here was done by Philip. 


Some photos and screenshots for anyone who might be interested
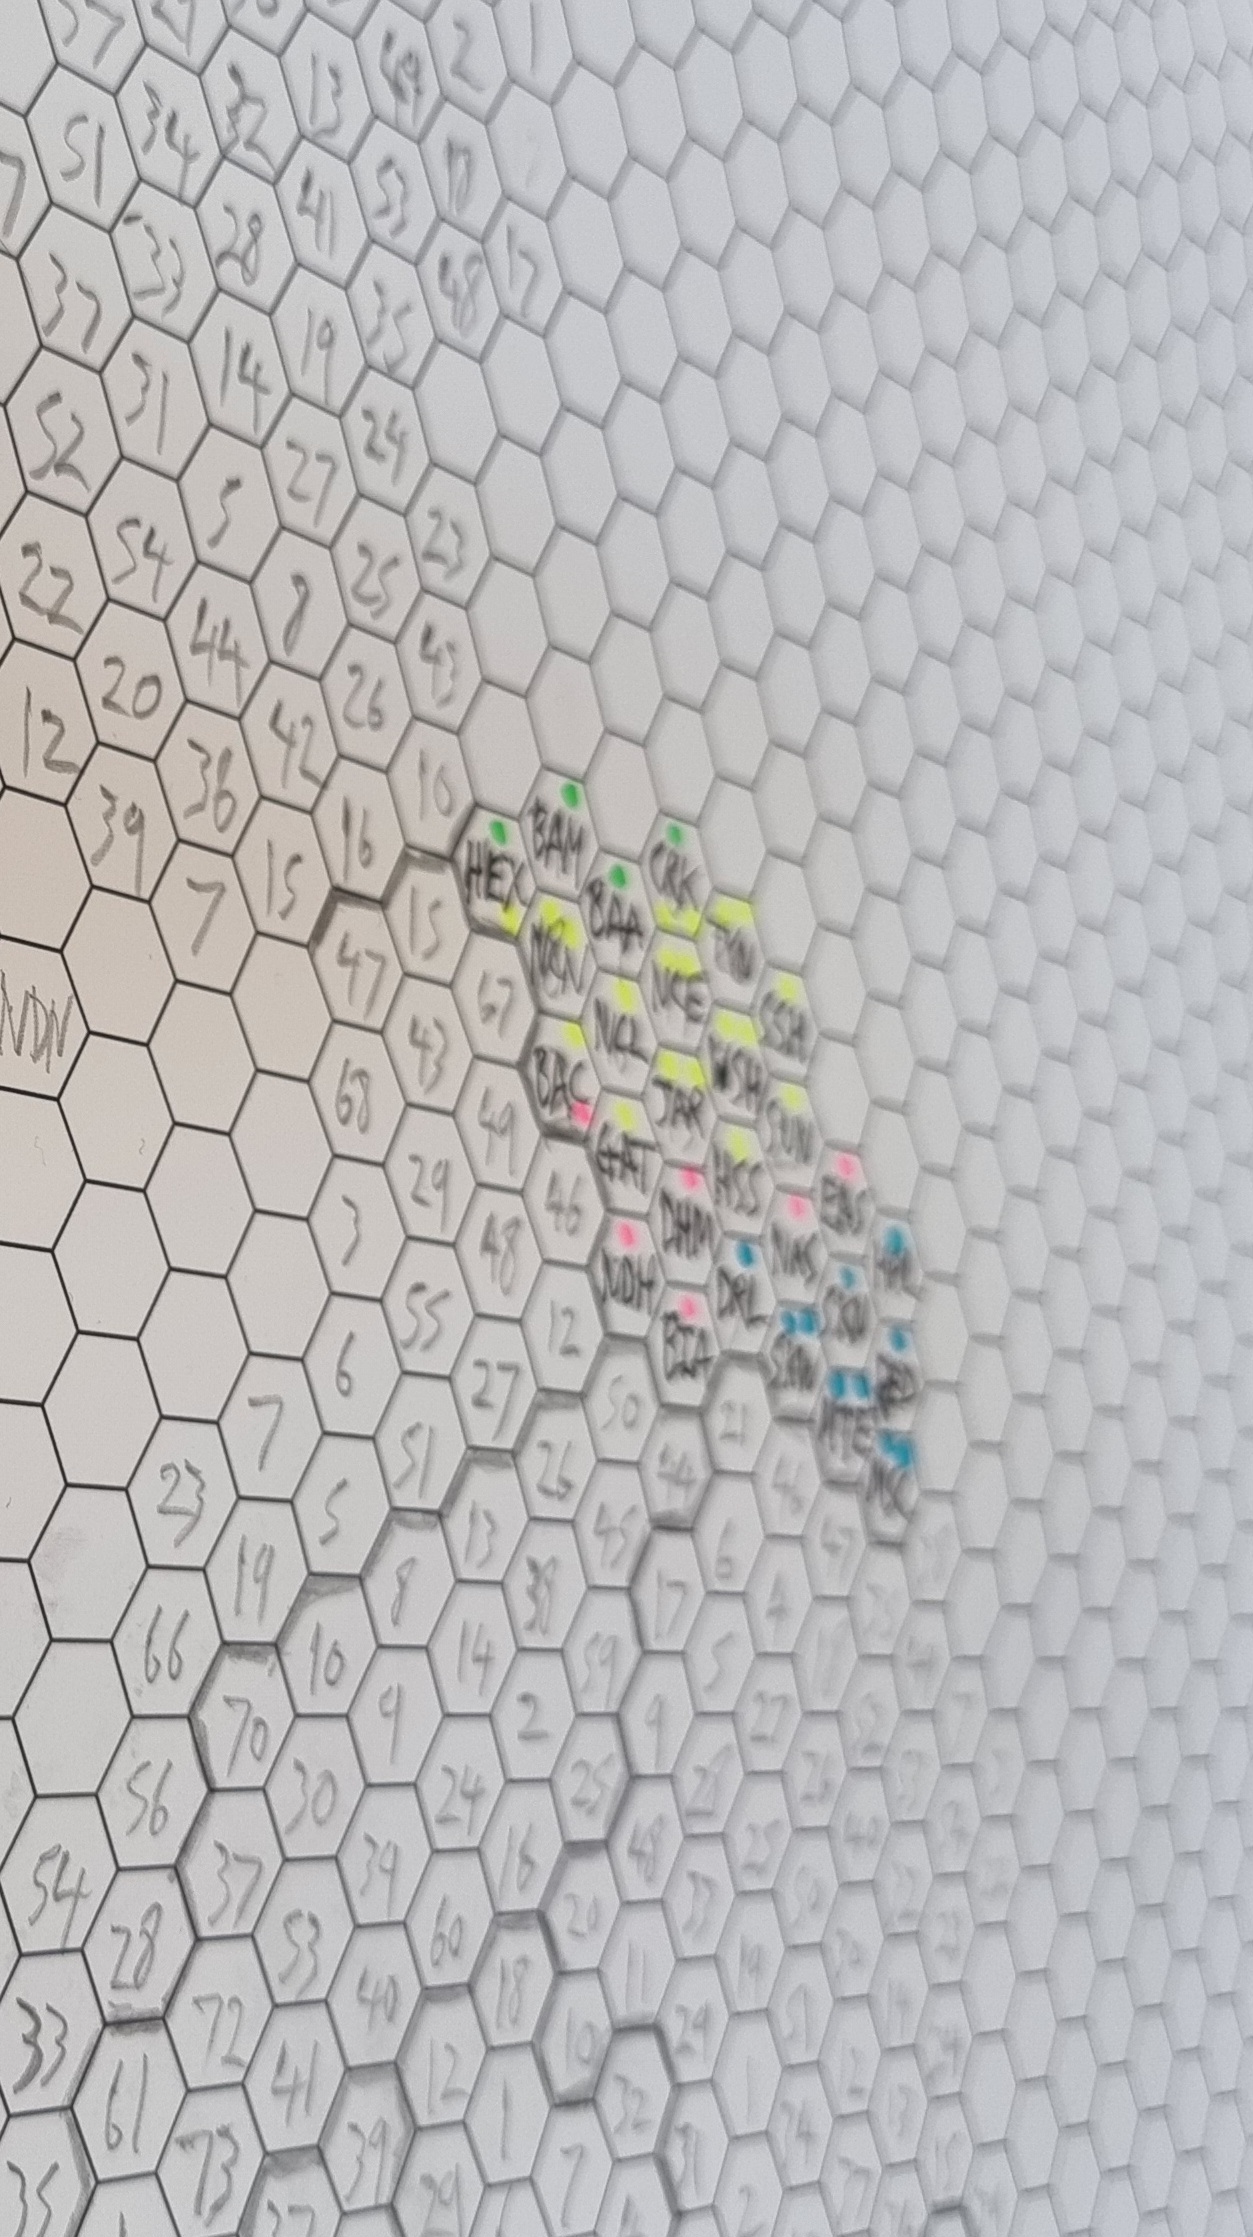
It was quite an interesting process. Working on paper was actually very useful so we'd recommend starting with a final shape in mind plus some big bits of hex grid paper if you are trying to do this yourself, but really all the hard work is in figuring out how best to arrange the hexagons. This is what takes so long. Imagine if you had a Word document with 650 text boxes in it and you move just one box - everything else gets totally messed up. Well it's a bit like that. A real headache. All maps are wrong. All hex maps are wrong. But we created the least-wrong hex map we could and we hope others might use it and find it useful.

Happy mapping!


Tuesday, 3 December 2019

Land doesn't vote, but it does matter

A short post today on the well-work topic of election mapping and, specifically, how to represent the results of elections in a way that reflects the true proportions of who voted for who. This isn't an attempt at a solution or a definitive answer, just some ideas and maps to provoke further thinking on the topic. Let's start by looking at two election maps (below). The one on the left colours in all constituencies according to the party of the MP at the end of the most recent UK parliamentary session. The one on the right is coloured in the same way but only where there are buildings. People like to use these kinds of maps with accompanying comments like 'land doesn't vote' or 'because sheep don't vote' (although I would like to see some polling on how they'd vote if they were so enfranchised). Scroll to the bottom to see the method for this in QGIS.

Standard map vs 'dasymetric' map
Some obvious stuff first... There's a lot of blue on the map to the left above. There is also quite a bit of yellow, and not much red. So, when we look at the map on the left it might give the impression of Tory dominance, when in fact they are not as far ahead as the colour share would suggest and  things are nowhere near as bad for Labour as it might appear from the colour share. Reasons include population density, urban voting patterns, etc, etc. But, but, but, when we get to this point, I always think "yes, true, but the vast majority of people know that". But then again maybe the vast majority of people have more exciting lives and don't think about this kind of stuff at all and end up being inadvertently misled my maps. Perhaps. SO, ENTER THE HEXAGON!!! Yes, it's our old friend, the hex map - example below from a new book. This definitely helps shift the story of the conventional election map from 'wow, the Tories are crushing the competition' to 'it looks quite close'. I quite like this approach, but with only a small quite and probably because of my own biases.

Hex for the win?

Yes, this hex map is better in many respects, but I'm not a huge fan of using these on their own and wouldn't really mind not seeing them again. But I do agree it provides a more useful representation of the vote share and as a compromise it's a fairly good one if we're interested in displaying vote share. I just think in this case a bar chart might be better if we're most interested in vote share, given how hard it is to get the hexagons arranged in a way that matches the underlying geography and what it does to my brain. That's why I've been experimenting recently with the dasymetric map style you see above. Talking of which, here are a few zoomed-in versions, with place labels, and a bit more discussion below.

What colour is your town?

This is a bit more informative I think

But I wouldn't use this approach on its own

Although I do think there is a place for this style

The colour balance is a bit more satisfying here

The last thing to say in this bit is that I also like the buildings-only maps with labels as it allows us to say a bit more about specific places. Let's imagine for a moment that there was a human being out there who didn't know the precise boundaries of the Berwickshire, Roxburgh and Selkirk constituency. I know it's hard to believe but I'm told such people do exist. They know it's a blue constituency and on the first map above they can actually see Selkirk (to the bottom right of the first labelled map) in blue, rather than a giant block of blue covering the entire area. 

Of course, this overlooks the fact that not everyone in the constituency voted for the Conservatives but that's another issue, and in a first-past-the-post electoral system I think shading by winning party is quite logical. Anyway, my point here is really that we can focus in on individual towns and how they voted without being distracted by giant wodges of colour that strictly speaking we do not need. I think the North of England map above does a good job of this - so you can just look at the east coast  of England and see that Bridlington or Scarborough are represented by the Conservatives and that Blackpool has a red wedge between two blue blobs on the west coast.

If you did want to colour areas by the strength of vote for one party then you could use what I call a 'staunchmap' approach, like the example below that I've shared previously. The deeper the colour the higher the vote share - e.g. see Merseyside and its deep Labour reds.

Who will win in 2019? I predict nobody will win.

So, what's my final verdict on how best to map elections? I think a mix of approaches is best, and because most of what we view is on multi-media platforms I think some use of animation might be useful, as in the gif I made already and shared on Twitter. In print or static format this could just be a simple side-by-side version, like the image at the top of the page. Actually, having just written this, I think broadcasters and print media should do both - perhaps standard map + hex + dasymetric or standard map + one other. Not that it matters that much but if we've got the data and tools seems like it would be a good idea to use them here and, maybe, pass on a little more information with this slightly different encoding.


Ooh, fancy - but it does add a bit of value I think


("land doesn't vote, but it does matter" is my usual thought on this, so I'm adding it here, and that's why I'm using a technique that does at least show the land at some point, before switching to a view that more closely reflects the numbers we're probably interested in. Plus, we can't have the Highlands zapped from the map, or at least not permanently.)


Data and method: a cumbersome way to do this would be to use a buildings layer to clip the constituencies but that would take ages. I did this in QGIS using a simple blend mode but it's possible with other tools as well. The data I used are from the spreadsheet I put together and shared on Github previously. You'll also find a constituencies file there to to join it to. You can grab the buildings layer from this page and then you've got all you need to replicate what you see here. Just take a look at the screenshots below to see how I did it. Just make sure your map canvas background is black (via Project > Properties > General).

This is the layer order you need

The constituency colours come from the attribute table

The buildings are all white, with a thin outline