Sunday 24 April 2022

How to import a Wikipedia table directly into Excel or Google Sheets in only a few seconds

A slightly different kind of tutorial today in that it involves no maps and instead is about how to get a data table from Wikipedia - or other websites - into Excel or Google sheets without any pain at all, and without messy copying and pasting. First I'll do this for Excel and then for Google Sheets. I'm going to be doing it with a table from the List of World Snooker Championship winners Wikipedia page, as of 23 April 2022, so the screenshots below reflect that but regardless of which table you choose, the method is the same. Note that there are multiple tables on the Wikipedia page I am using, just to demonstrate that even if this is the case you can still import the table you want to, quickly and simply. I am doing this from Wikipedia, but of course it should work equally well for any similarly formatted table on the web.

Messy copy/paste? No way!


Import a Wikipedia table directly into Excel 

I'm using Excel 2019 here but this should work on other recent versions too. So, the basic steps are as follows (screenshots are from Excel on Windows).

  • Copy the url of the Wikipedia page that your table is on - in my case its https://en.wikipedia.org/wiki/List_of_World_Snooker_Championship_winners

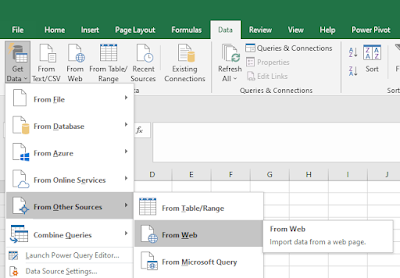
  • From an empty sheet in Excel, go to the Data tab, then Get Data on the far left, then From Other Sources, then From Web (as in screenshot below).
Well, this is useful


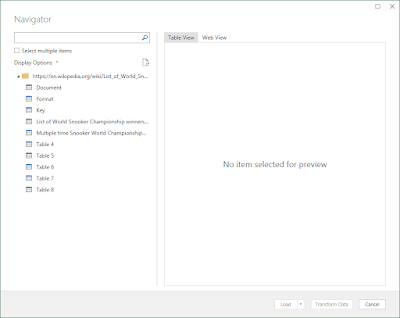
  • Then you can just paste your URL into the From Web box - here I'm doing it the basic way but there are more advanced options available. Once I've pasted in the URL, I just hit OK, Excel has a little think and then opens up a new Navigator window, shown below.
Excel lists the various tables at that URL we pasted


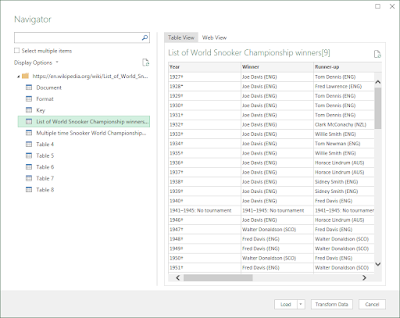
  • In the Navigator window (screenshot above) you'll see a list of tables on the left if there are more than one - as in my example. Since I know I want the List of World Snooker Championship winners table, I click on that and then I see a preview of the same data that's on the Wikipedia page, as shown below. Hurray!
Almost there

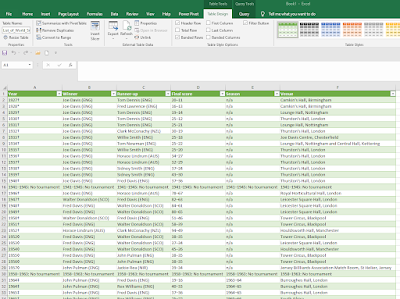
  • Then I click on the Load button and, well, would you believe it!? I see the data from the Wikipedia table in Excel now (formatted in green/white with column filters on, but that's not a problem). You will probably also see the Queries & Connections panel open on the right of Excel here, but that's also not a problem - you can close that if you want to.

Wikipedia table is now in Excel :)

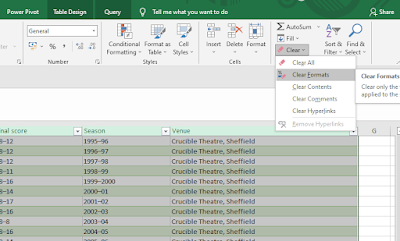
  • What next? Well, it depends what you need to do with it, but if you just want a clean, text-only dataset then you just remove all the formatting and save it as an xlsx or csv file and that's that. An easy way to remove all formatting is just to select all the text in the sheet (using CTRL+A) and then via the Home tab use the Clear tool to clear the formatting (screenshot below). If you want to also turn off the filters, then select one of the column header cells (e.g. Venue in my case) and then hit the Sort & Filter button in the Editing section in the Home tab (same section as the Clear button is in) and then hit the Filter button to turn the filters off. Save the file and then smile.
Clear the formatting quickly this way


Okay, so hopefully that has made someone's life a little easier and saved a little bit of time somewhere. Let's look at the same thing in Google Sheets now.


Import a Wikipedia table directly into Google Sheets

The method for Google Sheets is a little different but still works really well. I'll use the same Wikipedia table here - the List of World Snooker Championship winners table used above - and we'll get it loaded into our spreadsheet in no time at all. Follow the steps below to get there.

  • Copy the url of the page where your table is located - in my case it's https://en.wikipedia.org/wiki/List_of_World_Snooker_Championship_winners - and note that there are multiple tables on this page, but that's not a problem.

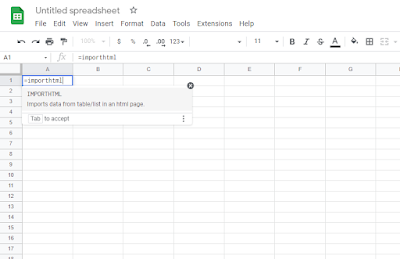
  • Make sure you have a new, blank Google Sheet ready to go - and then you are all set. In cell A1 of your sheet, type in =importhtml and then you'll see the importhtml function appear, as in the screenshot below. Note that you don't have to enter the formula in cell A1, but that's what I'm doing here just so that the table starts in the top left cell. Read on for how to complete the formula. You can just copy/paste my formula below if you want to.
importhtml is the magic function here

  • Now, here is the formula I entered - I'll show you it first and then I'll explain what each part does: =importhtml("https://en.wikipedia.org/wiki/List_of_World_Snooker_Championship_winners","table",3) - note that you don't need to enter the 'locale' bit shown in the screenshot below, but it's there so that you can specify different locales for things like date formatting etc (if relevant).
The different parts of the formula


  • The =importhtml bit tells Google Sheets to use the importhtml function - that is, it does exactly what you'd expect: it imports some kind of html text from the internet, like a Wikipedia table. It is followed by an open bracket and there is a close bracket at the very end of the formula, just like normal in Google Sheets and Excel.

  • Then we have the url we are importing the table from, in quotes, followed by a comma - so in this case I have "https://en.wikipedia.org/wiki/List_of_World_Snooker_Championship_winners" because that's where my table is. 

  • Then after the comma, I have to specify the 'query' bit we see in the screenshot above - that is just whether you want Google Sheets to import a list or a table, but in this case we know we want to import a table so we just enter table in quotes, like this - "table" and then another comma.

  • What does the 'index' bit do? Well, remember how we have more than one table on the page we want to import the table from? The index number relates to the number of the table we want to import - but note that this doesn't necessarily follow the order in which it appears on the page. It looks like my List of World Snooker Championship winners table is the second one on the page, but I had to enter a 3 to get it into Google Sheets using this formula. Just watch out for that, it can be a little confusing but if the table you're looking to import doesn't appear, try a different number here - the formula can always be edited by clicking on the cell you entered the formula into (in my case A1).

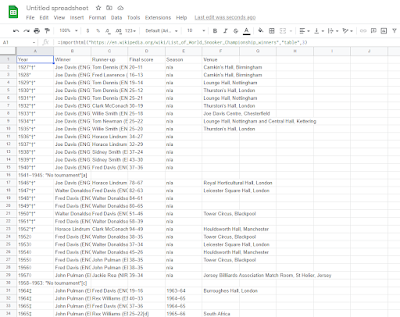
  • Then, watch in stunned silence while Google Sheets take a moment to think about it and then load your table, as shown below.
Wikipedia table in Google Sheets, in about a minute


  • If you want to save a text-only version of the table, just go to File, Download and then save it as a csv - or, copy/paste the data into a new sheet as text only, or whatever other method you happen to prefer. But the main thing is that you have the data and can now do what you want with it!


Hopefully this has been useful for someone - I know I find it useful when I need to get a table off the web without any fuss.

Why did I choose the snooker world champions table? Well, it has been played in Sheffield since 1977 and since I live here at the moment and went to a match recently between Mark Selby and Yan Bingtao it seemed like a good example to use. 

See below for some photos from the World Snooker Championship in 2022, just for the sake of it.


.


Saturday 16 April 2022

5G Cities

Since 2006, more than 40 billion internet speed tests have been carried out by users of speedtest.net and it's used by over 10 million people every day. Actually, their about page has a live ticker telling you how many Speedtest tests have been undertaken to date, if you want to have a look. The company behind Speedtest is Ookla, and they have their headquarters in Seattle, with another office in Dublin. Most of the world's ISPs and mobile carriers use Ookla data to help analyse their services. One of the great things Ookla do, beyond offering Speedtest, is share their data as open data. To cut a long story short, I took the most recent global data on mobile internet speeds for a number of different cities (staring with Seattle, below) and produced a series of 3D maps of mobile internet speeds. I also did a map of Mobile, Alabama - it seemed like it had to be done. There are lots of maps below - and below that I added a few notes on the data and so on. Remember that these are for mobile internet speed. 

Some seriously fast mobile internet in Seattle

Big internet energy here

Throwing some different shade

The mobile internet - from above!

I added labels to some of these

This is fast mobile internet

Don't settle for slow mobile internet in Seattle

Highest speed I found - that's a big spike!

And then cities across the world, below. For these I used a different colour scheme and no labels, just because you can only really read them when zoomed in. What's the width of the circles in the images below? Well, this varies depending upon the latitude each city is at, but it's typically close to 20km / 12 miles in diameter. The individual sample points are roughly 0.5km by 0.5km, but again this varies depending upon latitude. If you want to look at it on an interactive map then check out the Ookla Mapbox interactive. I've included a mix of cities below, including most that rank among the top cities worldwide for 5G. It takes a while to render each image, so I couldn't do them all. The vertical scale is the same for each city, so if you want to grab multiple images and put them side-by-side for comparison then feel free.


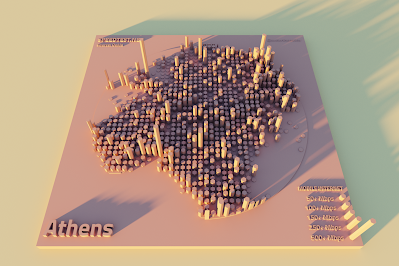
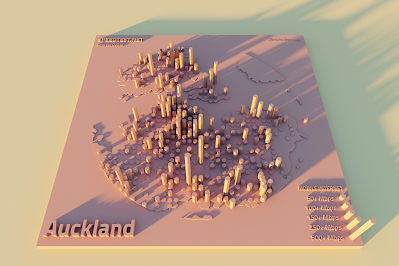
















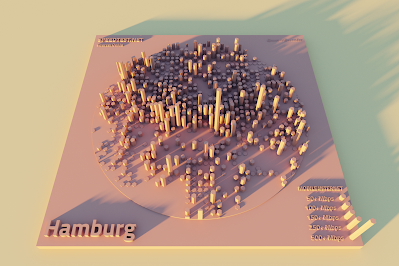








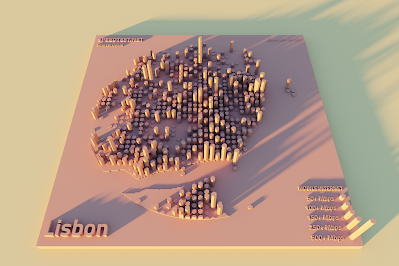
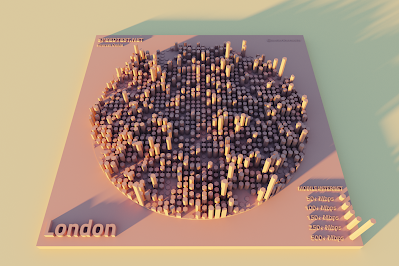
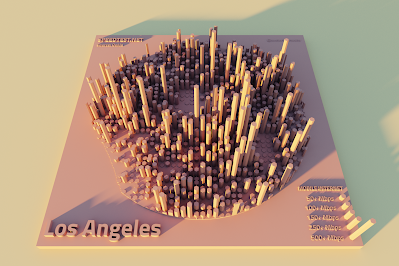
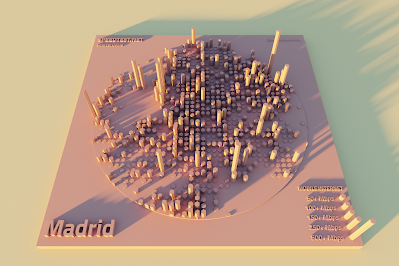




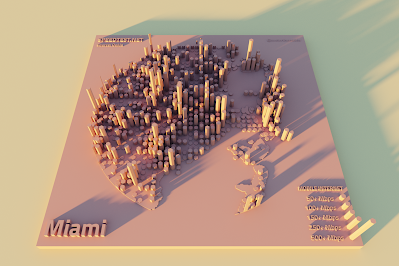


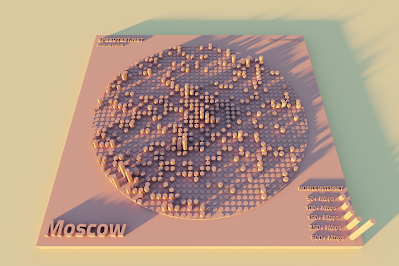



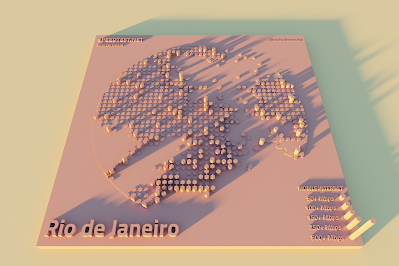










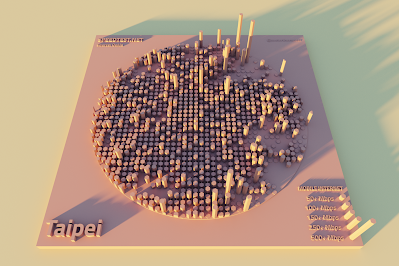
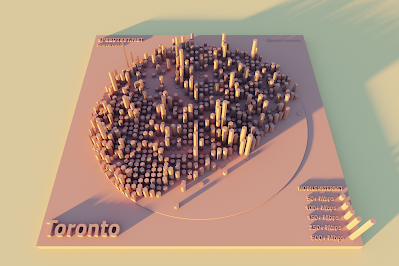
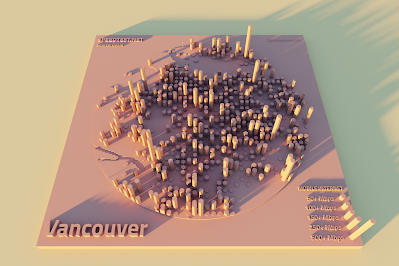



This was really just another experimental mapping piece with a dataset I've been playing around with for a while. I haven't used it in any real-world projects to date, but I think it's likely to come in very useful in the future as I can think of loads of potential applications.

I decided to run off a few more cities in England, including where I live (Sheffield), so see below for that.
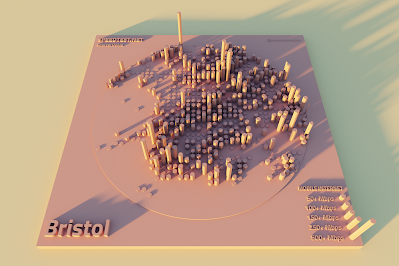


Notes: if you're looking for the raw data, you can find it on the Ookla Github open data page. The data is based on people testing their internet speed using speedtest.net. How big are the sample points? Here's what Ookla say on the open data page I linked to above: "This equates to a tile that is approximately 610.8 meters by 610.8 meters at the equator (18 arcsecond blocks)". Is there an R package for this data? Yes. Is this really open data? Yes, Ookla have made it available under a CC BY-NC-SA 4.0 license). Can you just grab a shapefile if you want to? Yes, they provide download files in shp format for both mobile and fixed internet on a quarterly basis - just go to the Github page and scroll down to the Download via URL section. How did I make these images? I used QGIS to create the basic layouts and then Aerialod to render them in 3D. See below for an example that you can just drop straight into Aerialod to render - it doesn't look like much below but once you load it into Aerialod it should look nice once you tweak some settings, but you'll need a Windows machine and a decent graphics card to make it work quickly. What about the fact that some areas have not much data? This is sometimes true for individual points, but even with a single test we have an indication of local achievable speed. But, in the case of these cities there is in most cases a lot of data to go on. Finally, the Seattle images at the top with the labels - I think the scale on the legend here doesn't quite match the main map area but since there are labels on it that doesn't matter too much.


Add this file to Aerialod

Apply the settings you see here


Postscript: I went out for a walk around my neighbourhood today to see how the speeds from the data compared to the speeds I got on my Samsung S21 Ultra phone. Basically, I got highest speeds in areas that the data suggested I would, although my top speed was 354Mbps, just outside the local ASDA, and I also got over 300Mbps in the local park. I don't get 5G signal on the street where I live though. All this in the name of dataviz, maps and science, of course.