Over a decade ago I set out to understand exactly where England's green belt land was by getting my hands on the raw data. Eventually it became open data and there's an update every year, along with loads of stats. At the time of writing, the proportion of land in England designated as green belt* was 12.6% of the total. But nobody lives in the green belt, right? Or at least hardly anyone, right? Or at least not that many, right? If you search online you won't find an answer to this question so that's why I've been looking at it on and off for a few years and now I have what I think is a good approximation of the total number of people who live in green belt land in England - 1.2 million or, to put it another way, more than in any single English local authority area (Birmingham has about 1.1 million people). That's 2.1% of the population of England.
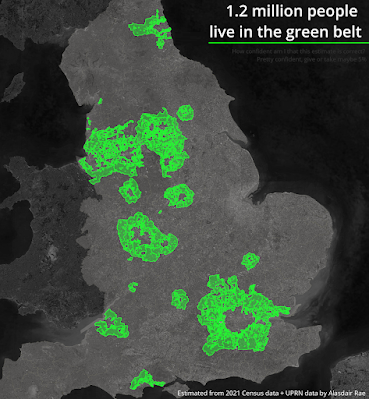 |
| I believe this estimate is pretty accurate |
Are you sure?
How can I be sure that this number is correct, after all we don't actually have population data that fits the boundaries of the green belt. For example, you can't just add up Census Output Area populations within the green belt because they do not nest neatly (at all) within the green belt and if you try this approach you will get a wildly wrong figure. That's why I used the OS Open UPRN dataset from Ordnance Survey because this allows you to identify individual properties. There's also AddressBase Plus but a) that costs a lot of money and b) we'll get to that later. So, because I used address-level data I am confident that my figure of 1.2 million people living in the green belt is pretty accurate but you will see some independent verification below too. Update: read on for more but my 1.2 million people in the green belt figure compares very favourably to the 1.15 million figure calculated using the 'ONS average occupancy count for "in use" properties (by OA)' stats in the spreadsheet from Drew.
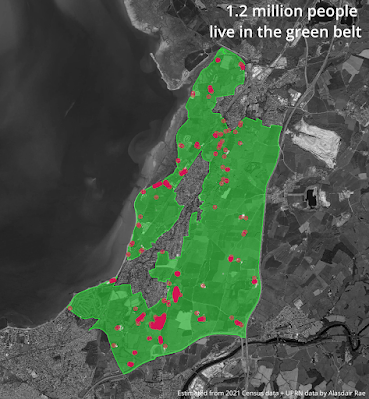 |
| The dots are UPRNs in buildings, green = green belt |
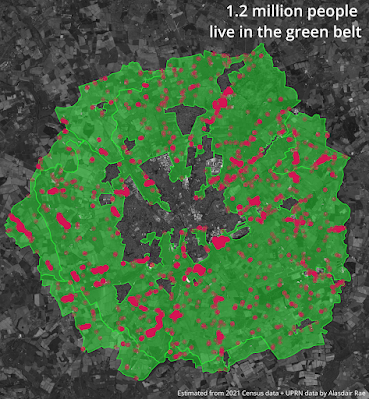 |
| York's green belt is very much like a big green donut |
My methodology, for anyone who is interested
How did I go about this? Well it went a bit like this...
- Get the latest green belt boundary file from DLUHC
- Get Open UPRN data from Ordnance Survey
- Get building footprint data from OS Zoomstack
- Add all data to QGIS
- Extract only those UPRNs (UPRNs are the authoritative identifier used to uniquely identify addressable locations in Great Britain) that fall within a building footprint, so that you're not including non-buildings etc
- Identify how many of these UPRNs within buildings fall within the green belt (I got about 34 million UPRNs in buildings out of 40 million total, and 593,273 were in buildings in the green belt in England)
- Then we do a comparison between the population of each English local authority area and each of the following: number of building objects from the OS Zoomstack dataset, total area covered by buildings, total count of UPRNs in buildings
- Then we bust out Occam's Razor to do a few simple scatterplots - compare each of the above to the population - to cut a long story short, you multiply my UPRN number by about 2 to get a total population
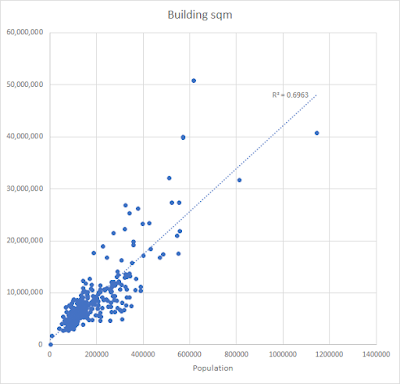 |
| Building area vs population: a bit messy |
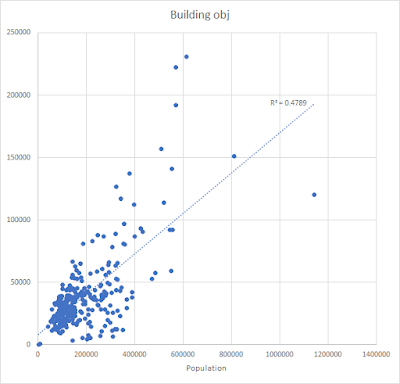 |
| Building object count vs population: too messy |
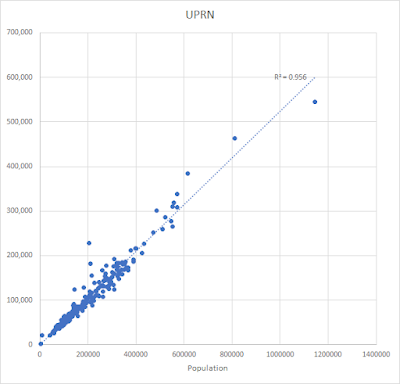 |
| UPRNs in buildings vs population: quite neat |
- So once I saw a fairly linear relationship between my 'UPRNs in buildings' count and the total population of each local authority district in England I decided to use this to estimate population
- Not all local authority areas have green belt though, only 180 of just under 300 do
- For those areas with green belt the relationship between 'UPRNs in buildings' and the population was even stronger so that's why I have a good degree of confidence that we can multiply by 2 here to get a decent population estimate
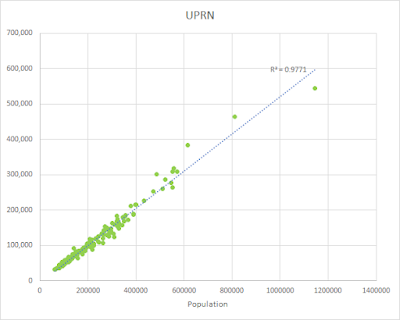 |
| UPRNs in buildings in green belt vs total population |
- This all leads me to a population estimate for the English green belt of: 1,186,546 - but this is too precise so I'm just saying 1.2 million.
Verification?
I did all these calculations myself and got a figure that seems pretty reasonable based on the methodology described above. It also feels about right - 2.1% of the population of England on 12.6% of the land area. The 2x multiplier for UPRNs in buildings to get population holds pretty much all across England as we can see from the charts above, and the relationship is even stronger when we look only at those areas that contain some green belt land.
If you check out an earlier post of mine on Twitter you'll see some other numbers which back me up, calculated using the very expensive and not-open AddressBase Plus dataset. I will add these below for reference.
Here are some screenshots of calculations that use AddressBase Plus, including some populations for the different bits of green belt in England. Thanks of course to Drew for these numbers derived from AddressBase Plus - here's more on his methodology.
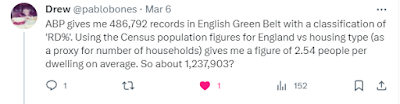 |
| ABP is AddressBase Plus - similar figure to what I got |
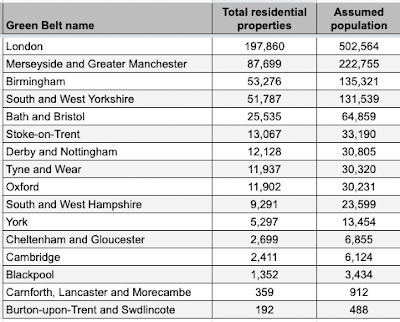 |
| Estimates for the different bits of English green belt |
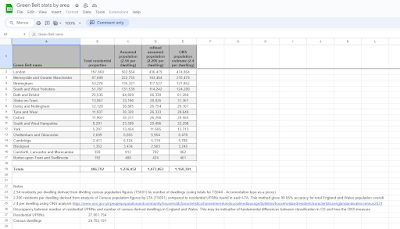 |
| A spreadsheet you can explore and have fun with |
If you look at the spreadsheet shown above you will see three different estimates for the population of the green belt in England, ranging from 1,073,863 to 1,236,452. My figure of 1,186,546 is very close to the middle figure in the spreadsheet of 1,168,301 which was calculated from the ONS population estimate of 2.4 people per dwelling. You will also notice a tab in the spreadsheet with green belt population by local planning authority.
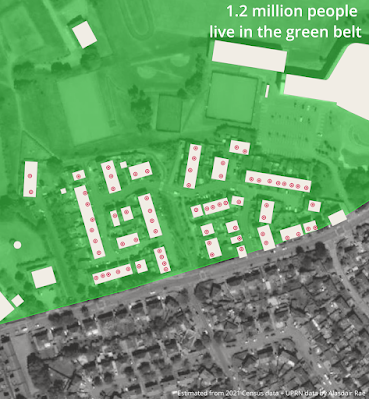 |
| The dots are UPRNs, the shapes are buildings |
So there we go. Why am I writing about this again? It's a long-standing interest of mine, plus it has also been in the news recently so I thought I'd take another look at it. Oh, also, I discovered that I'm only 430 metres from the green belt even though I'm in a very densely populated area.
Want to look at a map that has current green belt boundaries on it? Check out the National Map of Planning Data for England and then just turn on the green belt layer.
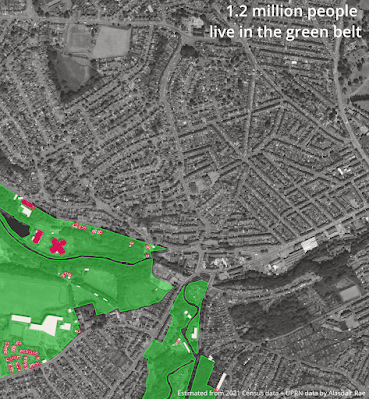 |
| Green belt near me, I didn't realise so close |
*'green belt' is how I'm writing it here but the government tend to use 'Green Belt' but of course if you're being proper you might say 'green belts' but we also see 'greenbelt' and 'Green belt' - I'm not fussed, it's all talking about the same thing