This is a short informational post on how to derive building heights using open data, for areas in England. I am also sharing the
data in the visuals you see below. However, if you have access to similar data in your country then you can replicate the method. It's basically the same as others have posted
elsewhere, so I don't claim this is a first - I'm just posting it in case others find it useful. And I've also added local authority names to the building outline files, hence the different colours you see. First of all, though, here's an example of what you get at the end of the process.
 |
| You can find the raw data in shapefile format here |
Of course, this alone would be no fun without having a little interactive version in the web browser, so here you go - knock yourself out! The buildings are coloured by local authority - blue for Trafford, purple for Salford and green for Manchester.
Here's the basic method for adding heights to the building polygons.
- Download some building footprint data. I used OpenMap Local from OS OpenData and this comes in named tiles (as per the naming conventions of the British National Grid - NH, NN, NS and so on). I used data from the SJ tile, covering Greater Manchester. When you download it you'll get loads of layers but in the data folder you should see one called Building.
- This building data doesn't come with any height attributes so we need to find a way to add that in. This can be done by using free, open LIDAR data available for England and Wales via the Environment Agency. You can also get aerial photography here, by the way. The data come in a variety of resolutions but I chose the 1m version as I wasn't overly concerned about precision. If you download the 25cm resolution LIDAR data the files will be huge. I downloaded tile SJ89 and both the DSM and DTM products. The DTM is a digital terrain model so it gives us the lay of the land, as it were, and the DSM is a digital surface model so includes the height of anything on the land beneath. The image below probably explains it best.
- I then add the DSM and DTM files to QGIS (I used version 2.14) as a virtual raster. Otherwise you'll end up with loads of individual raster tiles if you add them one by one because the SJ89 LIDAR data comes in lots of little chunks. You can find out more about this - and how to add a virtual raster - in this extremely useful blog post. The brilliant Owen Boswarva also has some really useful info and links on his mapgubbins site, so check that out too.
- Because the DTM gives us the height of the land and the DSM the height of any features on it, we need to use the Raster Calculator in QGIS to calculate the height of buildings. But fear not! This is also very simple, and is explained in the blog post linked to in the last bullet point. The only thing I did differently is I just manually selected the area of buildings that covered the SJ89 tile using the Selection tools in QGIS (and then saved it as a new shapefile layer).
- Before using Zonal Statistics in QGIS to calculate building heights - and bear in mind they are not exact - I just had a virtual raster which was obtained by subtracting the DTM from the DSM layer in QGIS, plus a buildings layer which covered the same area, as you can see below. It was these two layers I used to derive the building heights.
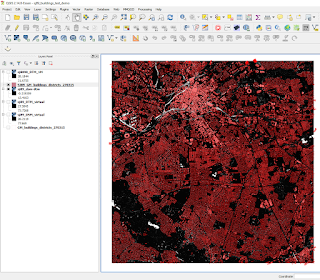 |
| This area is centred on Greater Manchester |
- Then I used the Zonal Statistics tool in QGIS to calculate a mean, min and max height for each building polygon from the LIDAR data. You could just use the mean but I wanted more information so I just left checked these boxes when running Zonal Statistics. The method is also described by Brendan, here, but you should note that in version 2.14 this tool will be in the Raster menu. Note that you may find nothing happens after running Zonal Statistics - don't worry, QGIS has just added the new fields (max, etc) to your shapefile without any fuss so check the attribute table.
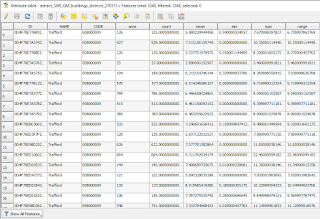 |
| Here's an example of my final shapefile, with new height attributes |
- Once you've done that, you should have the ability to analyse building heights and produce a fairly credible 3D model of your area of interest. Just bear in mind that things like pitched roofs, curved roofs and other shapes will not come out when using this Zonal Statistics method. For that, you could of course use the raw DSM data if you wanted.
That's it really. I'll finish with a final big version to which I have added some labels. Right click and you should be able to see it full size in a new window or browser tab.
 |
| Hastily patched together, but I hope you get the idea... |


