Showing posts with label os. Show all posts

Thursday, 6 April 2023

The longest straight line in Great Britain (without crossing a public road)

In short, I believe I've found a longer straight line without crossing a public road than the line identified by Ordnance Survey in 2019. Important stuff, clearly. Let me explain.

**Update, 8 April 2023: I've added a Part 2 to this now, where I find an even longer line in the same area. Also, be very careful if you try this route because it won't be at all easy and you may also be eaten alive by midgies, as well as all the other hazards like bogs, hills, snow, cloud and so on.**

This is a longer straight line than the one below

Back in 2018 someone asked Ordnance Survey a question on Twitter, as follows:

"what (and where) is the longest distance you can walk in a straight line in England/Wales/Scotland without crossing a road (defined as a paved surface for vehicular use)??"

Note 'a paved surface for vehicular use'. This is the most important bit for me and the reason I'm coming back to it again after years of working with this data and never quite finding time to investigate, until now.

It's an excellent question. The answer the OS team provided was then turned into a blog post on the OS website in early 2019, and you can read that here but see below for their map. There's also a fantastic short film of Calum Maclean and Jenny Graham walking the route. 

71.5km or 44.43 miles

Now, let me say a little bit more. I'm from the Highlands, know lots of this area pretty well from my days cycling around it on my mountain bike when I was a teenager, as well as loads of other trips over the years for all sorts of reasons. I also spend my days looking at map data because that's a big part of my job and because of that one thing troubled me a bit about this answer from Ordnance Survey. 

To be more precise, once again, it's the 'paved surface for vehicular use' part of the answer. I'll explain all below and my maps are very rough and quick but you'll hopefully see what I mean. 


The roads data

Ordnance Survey provide loads of great open data these days, and one of those products is their OS Open Roads product. Load it into your GIS software and it looks like the image below. You can see from just eyeballing it where the biggest gaps in the road network are - unsurprisingly, all in the north of Scotland. There are some gaps in England and Wales too but here I'm trying to find the longest straight line between roads in Great Britain so I'm focusing on the north of Scotland. The longest line in Great Britain is also the longest in the whole UK, because the density of roads in Northern Ireland is such that there's nowhere even remotely as long as the line above there.

All roads in Great Britain


This OS roads file is about 2GB in size and is really useful. However, when I've run different kinds of network analyses on it I sometimes run into problems because it also includes roads that are not public. These are typically flagged as 'Restricted Local Access Roads', and I've shown some of these in the zoomed-in map below in purple. You may think by looking that these are 'roads' but in reality they are usually unpaved private tracks but more on that further down the page. 

Restricted 'roads' in purple here

What do these restricted roads look like on the ground? Well, you can take a look via Google street view a lot of the time, and you can also get a sense for what public roads are just by hovering the street view icon over the map, like I've done below.

A much better representation of public roads

For example, if you travel down the road along the River Findhorn, you'll eventually get to the end of the public road. You can of course keep going on foot or on your bike because of the laws on access in Scotland but you can't drive down these routes (unless you have permission). 


The end of the public road


Another 'Restricted Local Access Road' - see what I mean?

If you download the roads file and then make public roads one colour (blue) and then the restricted roads a different colour and then make a head-splitting gif of the result, this is what you get. Study this for a while and then you start to wonder if you can find a longer line than the OS one from 2019. Sometimes restricted access roads are in places like caravan parks, cemeteries, and the like - but in the Highlands they are often in the hills too.

Loads of restricted access roads (purple) on the map

Using what I would consider to be the 'correct' OS roads file - i.e. the one in keeping with the original question and in keeping with the concept of public roads - I can get a longer line in the original Cairngorms route too, see below. Let's worry about distance over undulating ground later on.

I can get a distance over 74km (straight line) this way

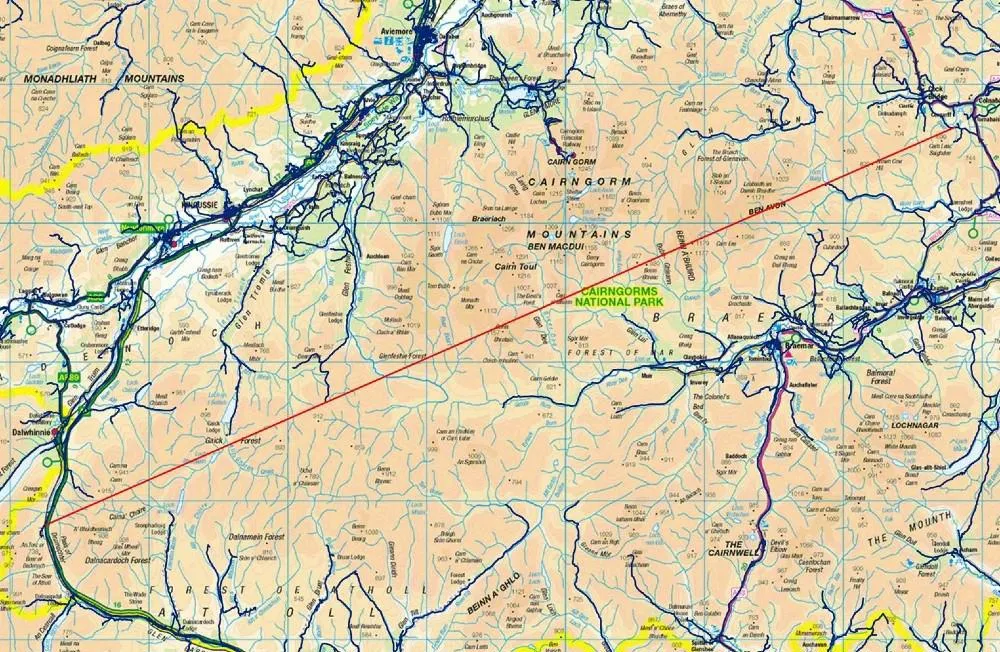
But with my glasses on I could see a potentially longer route, that just missed a couple of public roads, this time to the west of the A9 instead of the east. That's the map I posted at the start, and again below.

From the A9 to near Fort William, a nice walk

I've added terrain to this one, to show how tough this would be

Here's a height profile for anyone mad enough to be thinking about doing this route. It looks horrendously tiring and almost certainly quite dangerous unless you're a bit of an expert. Units are in metres below and the max is just about 3,000 feet, with lots of ups and downs. How much distance does this actually add to the straight line? 

Well, it's never as much as I'd think and it depends upon the accuracy of your terrain model but using the publicly available OS Terrain 50 dataset I get a distance of 77.0 km / 47.8 miles for this so a bit longer than straight line distance. I calculated this in QGIS using the Saga 'Profiles from lines' tool. 

A nice wee stroll

Anyway, that's what I get when I look at the data. A bit longer than the OS answer, but that's because I've tried to stick to the spirit of the original question. Get a different result? Found a mistake? Feel free to let me know.

Not easy

All these options are over 75km, and none are easy!

Data source: © Crown copyright and database rights 2023. © OpenStreetMap and contributors

Want the line file to play around with? It's in this folder, in geojson, gpkg, gpx and shp formats. File name is longest-straight-line-candidate followed by the various file extensions for each type.

Interactive map version of my original line 

How could you systematically, definitively find the longest possible route? With some difficulty but it could be done. My map above involved converting OS open roads to polygons, then vertices then connecting vertices then measuring the longest lines and so on. It's not a trivial problem to solve with 100% accuracy, at least not for me.

Saturday, 21 July 2018

A Review of OS Open Zoomstack

This is a long blog post all about something called OS Open Zoomstack. What? Yes, Ordnance Survey have released a product called OS Open Zoomstack, and it is very very good and you should know more about it. So here I am with a review. This is mostly aimed at people who might actually use the raw data to make maps, but also anyone who has an interest in mapping more generally. Put very simply, it's a giant, beautifully styled vector dataset for the whole of Great Britain. It can be used in a webmap (e.g. Mapbox) in a desktop GIS (e.g. QGIS) and other ways (e.g. PostGIS). This is what Ordnance Survey say it is:

"OS Open Zoomstack is a comprehensive vector basemap showing coverage of Great Britain at a national level, right down to street level detail."

But the best way to explain what OS Open Zoomstack is, is to just show you a couple of examples so I've embedded two maps below. The first is a kind of 'night time' view of Glasgow, and the second is a lighter overview map of London. Exactly the same data, just styled a different way and in both I have extruded the buildings by a few metres to give a little 3D effect. But actually both of these cover the whole of Great Britain which you can see if you zoom and pan each of them. Have a play around and then read on below for more information. There are links to full screen versions below.


Full screen - Glasgow


Full screen - London


Besides these examples, why not try a full screen version: as well as London and Glasgow, I've done Manchester, Edinburgh, and Portree (in Skye) but as I said, you can zoom anywhere you like in Great Britain. These places are just where I've set the map to start when you click the url.

If you want, you can edit the url yourself and share a map of any location in Great Britain. You can tilt and pan as well as zoom. To tilt for a different 3D view you may also need to hold down the CTRL/Cmd key or maybe use two fingers on a mobile device or tablet. It's worth trying this on a mobile device just to see how slick it is.

If you're still a little confused at this stage about what exactly OS Open Zoomstack is, take at look at the Ordnance Survey blog and then listen to what Charley Glynn has to say about it in the video. It's worth your time. The documentation is really helpful and even if you're not very experienced you can be up and running with it in no time, particularly if you're using QGIS. Talking of which, the series of maps below were all exported from OS Open Zoomstack in QGIS.

Whereas the examples above involved me uploading the vector tile set to Mapbox and doing a little bit of tweaking, the maps below simply involved downloading the data as a single file GeoPackage, loading it up in QGIS, re-ordering the layers, and then applying style files. You can find the instructions for this in the documentation and if you're an experienced QGIS user it'll be really easy. Even though the whole lot is about 10.6GB, it works very quickly for me on the machines I've tested it on.

This new release from Ordnance Survey is a also a nice demonstration of why the GeoPackage is - shudder - the future for geospatial data. No offence to Professor Shapefile, it's just the way things seem to be moving and this use case, for me, provides a good example that helps demonstrate where the GeoPackage has real advantages over the Shapefile. But I'm not here to talk about that right now.

Take a look at the different images below, and make sure you click to see them in full size. I've taken a range of snapshots from across Great Britain, with a few different zoom levels shown for London.  You'll see on the Knoydart one the impact that the contours have in giving the terrain a nice sense of relief. In my opinion this new product is going to be something of a game changer and so far I can't think of anything I don't like about it. 


Anglesey in North Wales - zoomed out

Central Bath 

Fort William and Ben Nevis

Birmingham city centre

Inverness (although OS use the Gaelic, 'Inbhir Nis')

The terrain of the Knoydart peninsula in Scotland

Leeds

Liverpool

London

Even more London

Zooming closer to the Isle of Dogs

Even closer

About as much detail as you can get

Middlesbrough - lovely detail

Norwich

Isles of Scilly - lovely styling

The 'west side', as they say (Lewis, in Scotland)

Southend

Swansea

This is Unst, Shetland

Wrexham, or Wrecsam

Under the hood
Let's take a closer look at what this looks like behind the scenes. The OS Open Zoomstack trial was announced on 17 July 2018 and runs for three months. You can get the data by following the links on the OS blog page about it. I've played around with two of the download options: the vector map tiles I used in the interactive versions above, plus the GeoPackage. Here's what they look like when you download them (below).


The documentation is also very impressive

If you're not familiar with what a GeoPackage is, and you are a GIS user, I suggest this is the time to get into it. Whereas a shapefile is a set of files that contain attribute and spatial data for a single type of geometry (points, lines, polygons), the GeoPackage is a single file (yes, just one file) which can contain all sorts of different geometries and also raster and vector data too. It's kind of a big container for spatial data. In practice, it will look the same as a shapefile in your GIS of choice but for very large datasets like OS Open Zoomstack I think it's much easier to work with. 

You can see what I'm talking about when you add the GeoPackage to QGIS and you are asked which of the 21 layers within the GeoPackage you want to add. It shows you what type they are, how many features they have and so on, as I've shown below. Once they are added, you just need to follow the instructions to get it all looking nice. This just involves re-ordering the layers and then applying the supplied style file to each layer. Be sure to copy the supplied SVG folder (screenshot below) from the OS Open Zoomstack download into your QGIS svg folder so that the Airports and Railway Stations  layers have the right icons. The folder path should be something like C:\Program Files\QGIS 3.2\apps\qgis\svg.

Here are the Zoomstack layers, all 21 of them 

The folder just needs to be copied to your SVG folder in QGIS

Once you've done all this - and it should only take a few minutes - you'll get a beautifully styled vector base map. As you zoom in and out you'll see that the symbology changes because the team at OS have very cleverly used the scale-dependent rendering options in the supplied style files so that you only see certain features (e.g. Railway Stations) when you are at an appropriate zoom level. This keeps the map looking good no matter what zoom level you are at. Here's what it looks like in QGIS.

Looking good, I'd say

Okay, so this 'review' has really just been a celebration of OS Open Zoomstack. But I think it deserves some love. Anyway, let's take one more look at the data, and how the scale-dependent layer styles work in practice. The two examples below show the Leith area of Edinburgh (I've rotated it 180 degrees so we're looking southwards) at two zoom levels. On the first, you'll see more generalised buildings but on the second you'll see the most detailed building data where you can pick out individual buildings. It's this kind of detail which really makes it work well.


Leith at a scale of 1:19,052

Part of Leith, at a scale of 1:9,526

What else? Here's my list of tips, things I like, and so on about OS Open Zoomstack.
  1. Because it's vector rather than raster data, it's perfect for creating highly detailed background mapping at any scale. Unlike some other products you won't (obviously) get fuzzy pixels when you zoom in, just more detail.
  2. Because it has so many layers in it, you can tailor these maps any way you like. You can also change the styling (colours, fonts and anything else) if you want to create a more unique, bespoke style.
  3. If you just want some data for Great Britain, for a completely different purpose, you can just load up the OS Open Zoomstack layers and use what you like. You could also save individual layers on their own, let's say if you wanted a single shapefile of places.
  4. In QGIS 3.2, I like the fact that I can load up the data, style it within a few minutes and then export high resolution images without even having to open a Print Composer. This is now possible directly from the main map view in QGIS via Project > Import/Export > Export Map to Image... (as in screenshots below)
  5. Because it's Ordnance Survey data, you know it will be comprehensive, up to date and authoritative. For example, the new bridge across the River Ness in the Higlands (below) is of course shown.  

It's a perfect partner for QGIS

You can now set dpi, extent, etc directly from the map view


The latest bridge over the River Ness in Inverness

Finally
As I said above, this is really just a celebration of a new dataset but it is also a review. I think OS Open Zoomstack is exactly the kind of thing the geospatial community in Great Britain needs but I also think, from a desktop GIS point of view, it will be very helpful in making people think again (or for the first time) about the GeoPackage. 

OS Open Zoomstack demonstrates why the GeoPackage is actually far superior to the trusty shapefile in some instances. In others, I'd say it's just another spatial data format that most users can't see the benefit of. I'm not anti-shapefile at all, but this really is an excellent example of a use case where GeoPackage wins hands down.

The only thing I haven't solved yet is how it came to be that some places in the Highlands (where I'm from) now have Gaelic names by default and some don't. I've read the Gaelic place names policy from Ordance Survey (thanks to Liam Mason) but am still none the wiser as to why Inverness is now Inbhir Nis by default and, for example, Shawbost is not Siabost but only a few miles down the road, Tolsta Chaolais is Tolstadh a' Chaolais. But this is nothing to do with Zoomstack so I'll end here.

Happy mapping. I couldn't help myself (see below). Every zoomstack needs a geogif.


What Zoomstack looks like at different scales