Showing posts with label labels. Show all posts

Wednesday, 11 January 2023

Label callouts in QGIS

This is a short tutorial about how to display label callouts (sometimes referred to as 'leader lines') in QGIS. This has been possible for a while, but not everyone knows it's possible, or how to do it. So long as you're using QGIS version 3.10 or later, you create callouts for your labels very easily. Before going any further, here's an example of a map where label callouts would be useful (below). And here's the map layer I'm using for this tutorial, in case you want to follow along with the same data.
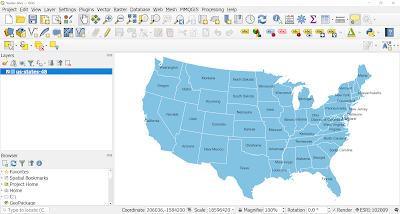
Very crowded labelling in the Northeastern United States

In the example above, some labels are okay, but in New England in particular things are a bit crowded, and in some other cases as well we might need to move things around. And note that I won't bother making things look particularly pretty here at all, this is all about the method.

So, here's two useful things to know for now - this is just for information right now, we'll look at how to change things further below.

  • The Label Toolbar (it looks like the image below, and if you don't see it you can turn it on via the View menu then Toolbars). We can place labels wherever we like using the Label Toolbar.
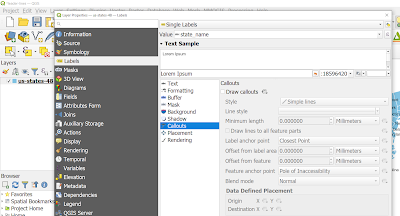
  • Where to find the Callouts options for a layer. For this, you need to go to Layer Properties (easiest done via a double-click on the layer name in the Layers Panel, or via a right-click then Properties... then Labels and then the separate Callouts section - again, see below for a screenshot of how it looks, in this case in QGIS 3.26).
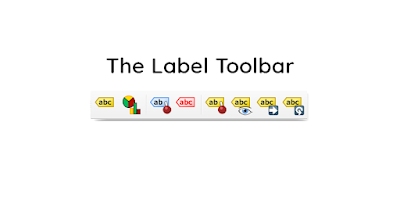
Yes, this is what it looks like!

Here's where you find the Callouts options

Okay, but why would we want to use callouts? 

Well, we want to make labels easier to read and because some states are small (NH, VT, etc) we just can't fit the labels on top of - or inside - the shape of the state. Not everywhere can be a Texas or a Colorado! And that's fine.

Also, anyone who has done any mapping - or even looked at a map - knows that labelling is super important. Done well it can make a massive positive difference. Done particularly badly and it could ruin a map.


Let's draw some Callouts

Now I'm going to add some callouts to my US lower 48 states layer that I showed you above. This is done in Layer Properties > Labels for the layer you want the callouts on. So the first thing I'll do in Layer Properties is tick the Draw callouts box (below) and then click OK to activate callouts. Oh, boo. Nothing happens, but that's actually fine. 

This is how we make callouts active

Next I'm going to use the Move a Label, Diagram or Callout button to move some of the labels in the Northeastern United States. It looks like this (below) in QGIS version 3.26 and should look the same - or very similar - on your version of QGIS too.

This is the important button!

Next, I hit the Move a Label, Diagram or Callout button as shown above, then I select the first label I want to move, just by clicking on it - in my case I did this for Vermont and as soon as I did I got a pop-up, which unless you know what it's asking you can be baffling! It's not a problem, just keep reading for how to deal with this.

This little window (shown below) is QGIS asking you to use a unique column in your attribute table so that QGIS can store the X and Y coordinates of where you move your labels to, more or less. But you don't really need do know that so just click OK when you see the Auxiliary Storage: Choose Primary Key window, as shown below. It should just be on fid by default but really unless you're into this kind of thing you can click OK. At the bottom of the blog post I tell you how you can reset this, if you need to.
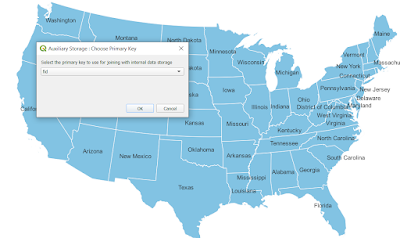
You can just click OK here

Then, making sure you've still got the Move a Label, Diagram or Callout button selected, you can move a label to somewhere where it has more space - so it's easier to read. This takes a bit of time, judgement and skill but don't worry if you don't get it right first time.

See below for where I've done this for lots of states - quite messily I might add. But that's fine at first, you can experiment with it later. At this stage I'd usually move some of the other state labels as well, to improve upon their positions - e.g. Florida, California, etc. This won't add a leader line because that only appears if you move the label further away from the feature.
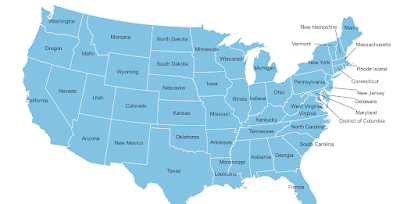
We've made some progress! Oh yeah

But let's say we want curved callouts, because they're nice, right? 

Let's try that instead. To do this, we go back into the Layer Properties, then Labels and then in the Callouts section we change the Style from Simple lines to Curved lines, as shown below. 

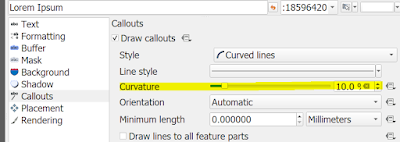
If you don't see all the same options as me, it's more than likely because you're using an earlier version of QGIS - or perhaps a later one. At this point you can also experiment with different curve options, like Curvature (a higher value here = a bendier line). For now I'm just going to accept the defaults and hit OK. You can always experiment with the settings later, including the different anchor points options.

The different callout options

Curvature, and other options

I've gone with curved callouts in the map below, and I've moved the labels a bit too, in an attempt to try and tidy things up.
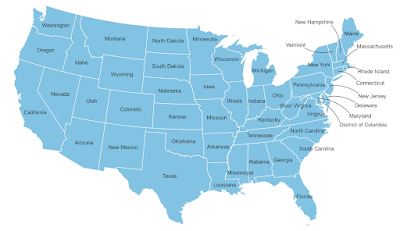
Staring to look a little better now

Couldn't we just use state abbreviations in these states, like NH for New Hampshire? Yes we could. But sometimes we want full names, plus not everything can be abbreviated. 

What about callout colours, widths, font sizes, styles and so on? Good question. You can go back into Layer Properties and then Labels and then change all that in the Text and Callouts section, as shown below when I did it. I used a callout stroke width of 0.1 instead of 0.3 and I changed the font, added a buffer and a little shadow too.
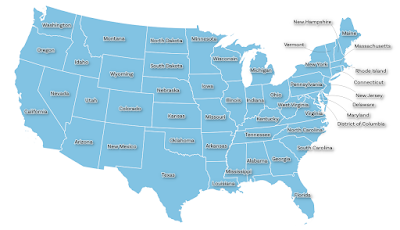
This is starting to look a little better

What if, say, we want the callouts to point to the edge of the state rather than the middle? Well, that's something we can change in the callout options by changing the anchor points, as I've done below where I set the Feature anchor point to Point on Exterior.
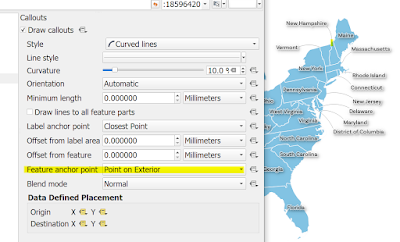
The callout now points to the edge of the shape, not the middle

As you can see, I've gone a bit wild with the colours now (below), but just for fun. But you can also see that I've tried to make the labels all neat and tidy and get the callouts looking good too.
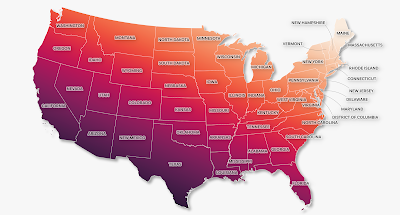
This is more like it - at least in terms of the callouts

So, to recap on this bit...

  • Make sure you can see the Label Toolbar
  • Turn Callouts on via the Layer Properties, in the Labels section, and pick what kind of callout you want.
  • Experiment with placement, as well as font styles, line styles and so on.
  • Experiment a bit more.

Other things to think about - e.g. different kinds of data

The example above uses US states, but there are lots of cases in countries, regions and cities across the world where such an approach is useful - e.g. where some labels will fit within features but some won't and you need to find a solution. 

Sometimes callouts are the solution. But sometimes we might want to have callouts on every feature. We can do that too, but it's not necessarily that obvious at first so let's have a look.

To turn callouts on for every feature (e.g. points, lines or polygons) - and actually see the callout lines...
  1. Go to Layer Properties for the layer you want the callouts on.
  2. Go to the Labels section and turn labels on.
  3. Within the Labels section go to Callouts and turn them on.
  4. I tend to use curved lines rather than straight lines, but it's up to you - it all depends.
  5. Now go to the Placement section, still within Labels - it should be below Callouts (see screenshot below).
  6. By default, the Distance in Placement will be 0, so when you turn callouts on you won't actually see a line unless you increase the Distance. The Distance here refers to how far the label is away from the feature (e.g. a point).
  7. You probably won't want to have callouts on every feature most of the time, but that's what this does. See below for an example with a US cities layer. Once you click OK to exit Layer Properties you'll see the result.
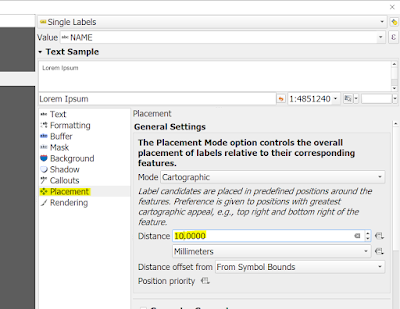
Placement is very important with callouts

We don't always want callouts, but sometimes we do

Once you've done this, you can of course move labels around using the Label Toolbar, just like you did before.


Other useful/important stuff

Okay, so we've got some callouts now, and that's fine. But as you can probably tell there are LOADS of other things you can tweak with labels so I'm not going to cover everything. It's just a case of trying this and then experimenting with all the options. However, there are a few extra useful and/or important things I think you should know.

Once I've manually moved labels using the Label Toolbar, how do I reset the label positions to get them back to how they were originally?
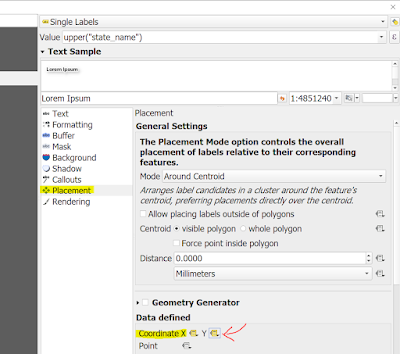
A good question! Further above when we started to move labels I mentioned how you get that mysterious Auxiliary Storage: Choose Primary Key window pop up when you start to move labels. I said to click OK, and that was fine because it works. But you may not have noticed that it changes the label placement settings under Data defined, as shown below. To reset this, just click the X and the Y and hit Deactivate and you should be back to the original default placement.

Not a lot of people realise this is here


When I turn on labels the callout goes to the centre of a point feature and I don't like that!
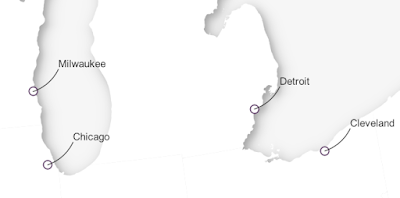
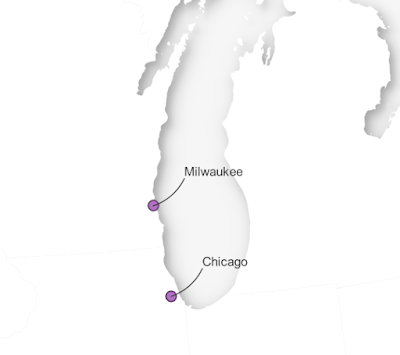
Okay, yes, this is a good thing to know how to fix. You can see below in my US cities example how the callout goes right into the centre of the dot. I don't want this so I need to change some settings.

Callout goes to centre of the point feature

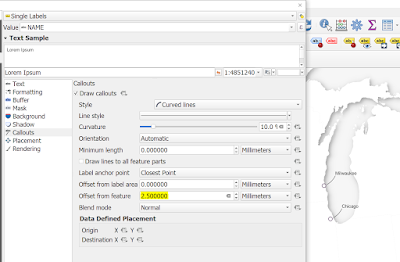
Offset from feature is what you need to edit here

As you can see from the screenshot above, I've edited the Offset from feature setting to move the callout line away from the point a little bit - I think it looks better this way. You can also experiment with lots of other settings here, depending upon what you want to achieve.


What do Manhattan lines look like? 

Another good question. They look just like the example below. They are called Manhattan because of the street grid in Manhattan, which is all right angles - well, a lot of it. 
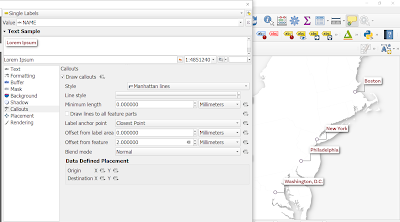
Just take time to experiment here

Okay, that's it for now. This post is a bit messy but I'll fix any errors or clarify anything that isn't clear if anyone gets in touch. See below for a little animation of different callout types - using a dataset for US cities. I wouldn't normally need to use callouts here, so this is just for demonstration purposes.

Hope you find this useful!
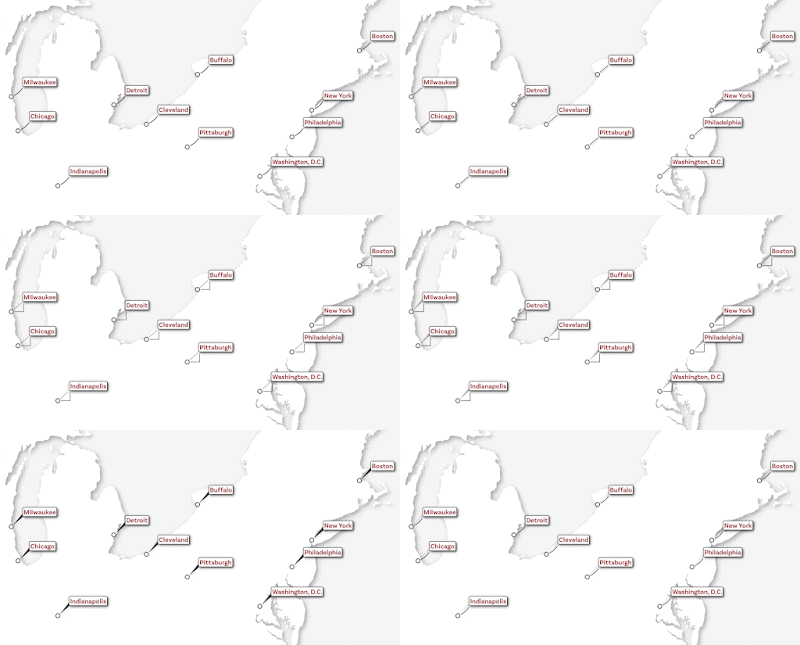
But I wouldn't usually use callouts in this case!


Thursday, 30 June 2022

Labelling tips and tricks for QGIS

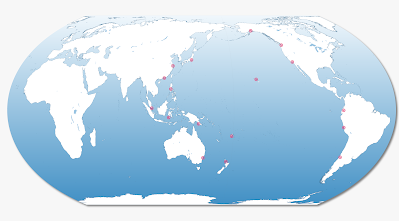
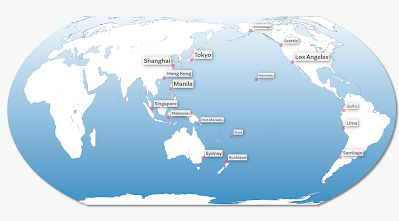
It has been said that making a map is 80% labelling, and 20% everything else. Okay, I just made that up, but if you've spent any time at all using GIS software you'll see the truth in this. Sometimes I end up spending far too much time on labelling, but then again it's usually time well spent because it makes things clearer. Too many labels and we're overwhelmed, too few and we're left guessing. I put this post together for anyone who uses QGIS and wants to know a bit more about labelling - just some tips and tricks for general use, regardless of what QGIS version you're on. I'm going to do this on a Pacific-centric world map, because there aren't enough of them and it's nice to look at things from a non-Greenwich perspective. Here's a little example map below, and then everything is explained after that. I'm working on this kind of thing for my next Map Academy course on Udemy.

A little example, using data from simplemaps.com

The data

As you can see, I'm using a Pacific-centric world map layer. This is based on the Natural Earth land layer and I just clipped it at 30 degrees west so that when I projected it using the Sphere Equal Earth Asia Pacific CRS in QGIS it didn't go all weird with Greenland and Antarctica split across the meridian. But of course you don't need to do this if you want to follow along - you can just add any world map layer, or none at all, because this is about labelling places.

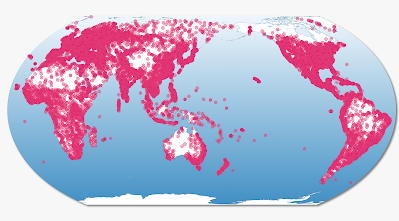
For the cities layer, you can get it at simplemaps.com as a csv and then load it into QGIS, but I already converted it to a world cities GeoPackage so you can just download that directly and add it to QGIS if you want to follow along here. There are over 26,000 places in the file though, so when you add it you'll see too many places to make sense of - but we'll filter the layer to sort that out in a moment. For now, here's what the whole lot looks like.

Lots and lots of dots

Okay, so this is fairly typical when we add a cities or places layer to QGIS - or indeed any GIS software. We're overwhelmed with dots so we need to think about how to filter it somehow. That's next.


Filtering the data

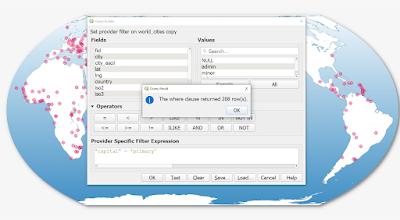
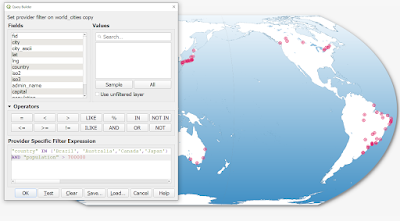
Before we label, let's filter the data. You can use the columns (also known as Fields) in the Attribute Table to filter the data - and you can see below that I've done this using "capital" = 'primary' so that only capital cities are showing on the map.

Okay, this is looking a bit better

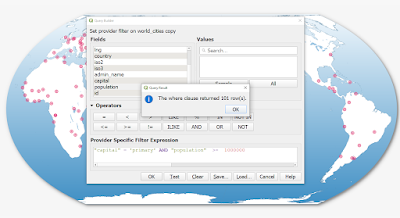
But let's say we only want larger capital cities to appear - e.g. those with more people. We can use the population field in the dataset to filter further, like I've done below to show only capital cities with 1 million people or more.

You can see how to use the AND operator here

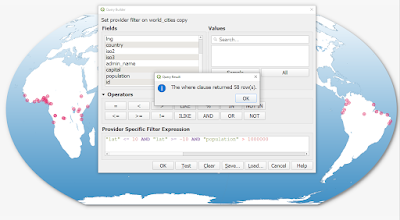
We also have a latitude and longitude column in this dataset, so we can use that to filter the data too. This time I'm going to filter it to show only those cities within 10 degrees of the equator that have more than 1 million people (according to the population column in our dataset).

You can filter using any of the columns in your dataset


One more filter now - this time we're looking at cities in Brazil, Australia, Canada and Japan with more than 700000 people - according to the simplemaps dataset.

Using IN as well as AND this time

What about labelling? 

This post is supposed to be about labelling, so let's talk about that in a moment. I just want to emphasise that BEFORE doing any labelling it really is worth thinking about what you want to label - and how many features there are as well as where exactly they are - e.g. are they overlapping?

I wrote a filter expression so that I'm only showing the cities you saw at the top of the post - a selection of cities on or close to the Pacific Ocean. 

I filtered the dataset to focus on only a few cities


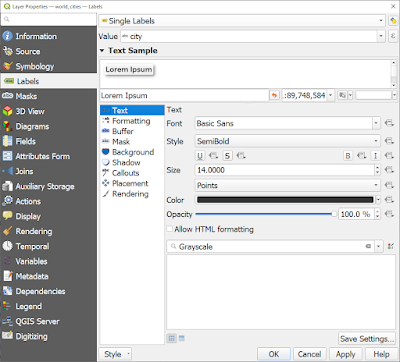
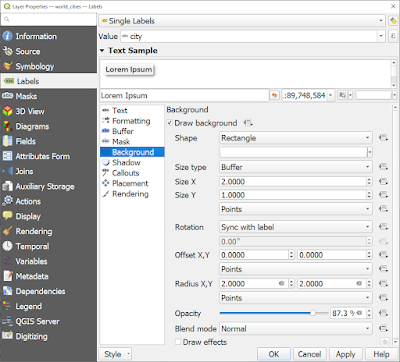
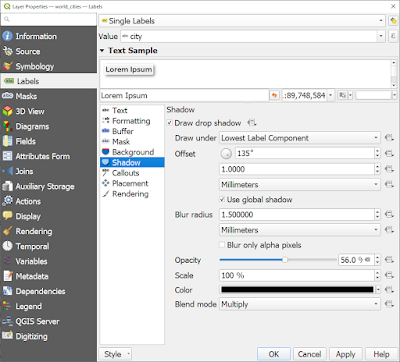
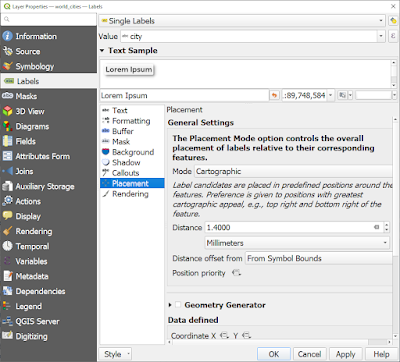
The next few images show you what label settings I've used here - a variety of different methods, including a slightly transparent white background to the labels.

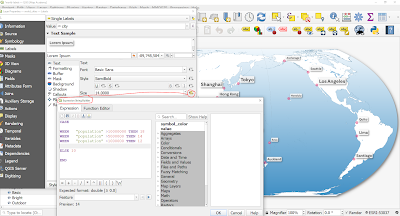
I'm using the city field to label the cities, size 14 font

Note the Size X and Y variables, and the Radius X, Y too

Drop shadow on the labels, with Opacity turned down

I've moved the labels away from the symbols a bit here


Visual hierarchy

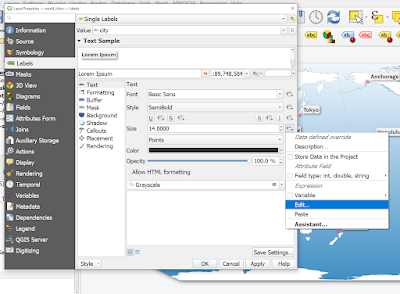
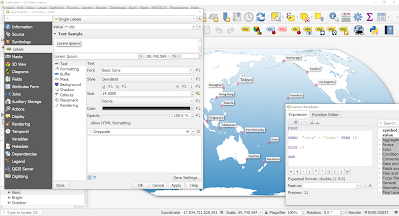
There are so many things you can do with labels in QGIS, but one really useful thing is the ability to set the size of labels based on a variable. So let's do this with the cities above so that larger cities have bigger labels. There are many ways to achieve this but I'll do it a fairly simple way. I'm using the Data defined override button beside the Text size option, as you can see below. Look at the expression I've used and you'll see how I modified the size of the labels this way, starting off initially with just Tokyo being in large font.

The Edit button (via the Size section) is how I change things

Note the format of this - e.g. CASE, WHEN, ELSE, END

Now I'm starting to get a more useful visual label hierarchy

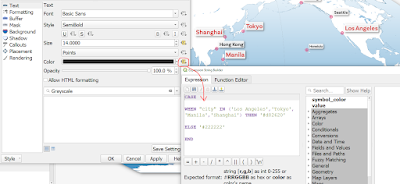
Now in the map below I've made the largest cities a different colour, using the same kind of approach - as you can see.

I'd normally use just a single colour, but you don't have to

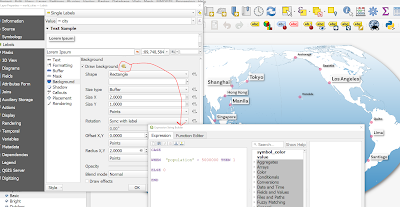
In the example below, I'm only using a label background on cities with more than 5 million people, using the same kind of approach.

Note the 1 and 0 values here, where 1 = true

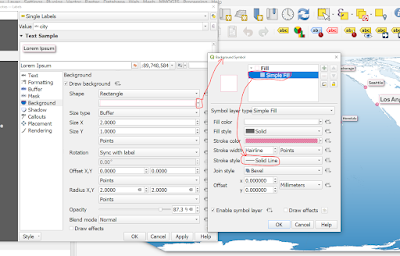
And then in the final image below I've added a thin line around the label backgrounds, just to make it a little bit crisper on the screen.

This require a few clicks, as well as editing the Stroke style

Here's the final version of this simple label map experiment, in high resolution. What I'd normally do beyond the labelling is also apply some kind of size hierarchy to the city symbols, and this can be done using exactly the same approach - i.e. edit the symbol size using the Data defined override and then setting it based on city populations or city names - or whatever variable you want.

Hopefully this has been useful for you


That's all for today, but if you're new to it and need some help, feel free to get in touch.

Sunday, 23 February 2020

A few flow maps + data to play with

I've written a fair bit about mapping flows (e.g. migration, commuting) over the past decade or more and here I am again. The point of this post is to a) share some data so that anyone who wants to play with it can have a go; b) talk a little bit about visualising flows; and c) to look at the functional economic geography of England.

First of all, here's the underlying data - it's 2011 MSOA-to-MSOA commute data for England and Wales, which comes from the Census. Yes, it's getting quite old now but it's still a useful dataset. It's a big shapefile, with columns for total commute flow between LSOA and also different modes (train, bus etc) and some other stuff (e.g. distance, area codes and names).

Here are some of the maps I extracted from it. The lines are the commuting connections between places, with an addition blend mode added in QGIS, plus a scaling factor is used to make smaller flows dimmer and larger flows brighter. I've filtered the dataset to show only MSOA-MSOA flows of 10 or greater, otherwise it's a total mess. Here are some of the maps.


Okay, lots of shiny maps to see. With the opacity of the lines set to reflect the volume of the flows you get a slightly better overview of commute patterns. The addition blend mode gives the shiny effect, which is in some ways just a bit fancy but actually it serves a purpose here: making the main economic centres brighter, which fits in well with the underlying economic geography of England and Wales.

Talking of the functional economic geography of England more broadly, there are connections to my previous work with Garrett Nelson on US megaregions (e.g. our interactive map site, with similar shiny maps but driven by an algorithmic partitioning process) and you can get a sense of where the break points are between different areas.

Talking of which, if you're interested in this kind of thing, check out the AMA Garrett and I did on Reddit about the US commute work as part of the PLOS Science Wednesday series. The comments here are pretty interesting, particularly those from commuters about where they draw the line themselves between travelling to city A vs city B.

That's all for today - feel free to download the data and have a play, use the maps as you see fit, or get back to me with any questions or suggestions.

Oh, and if you do download the dataset, you'll also see that I have added origin an destination codes and names for MSOAs and local authorities. This is useful if you want to, for example, only look at all flows into Manchester, or all flows between Leeds and Bradford.


Data notes: MSOAs are small geogaphic areas with between 5,000 and 15,000 people in them, or between 2,000 and 6,000 households. Most have about 8,000 people and 95% of MSOAs had a population of between 5,443 and 11,579 at the time of this dataset is from. Want to know how to do this in QGIS? See my flow map tutorial from a few years ago. Want to know more about the glow effect? See this tutorial on glowing lines in QGIS. And the place labels? I put together a single file of Great Britain place names if you want to use that. I've used a couple of rules on which places to display, plus added some in manually. Thanks to Allan Walker and Richard Mann for making me think a bit more about this again.

Saturday, 16 March 2019

Alternative Maps

This is a blog post about some maps of places that we don't often see on maps in Britain. I've had these stashed away for a while, since late 2017 when I wrote a piece called 'Alternative Maps and the Future of Brexit Britain', which you can see below. I've been thinking a lot more about this recently as part of my role in the UK2070 Commission, and also because I'm going to Redcar this week. But really this is just some personal musing about maps and in particular maps of the kinds of places that often seem to be left off the map, particularly in conversations at a national level. Scroll down for the maps. There's not too much more to it than that, but I thought looking at some of the less mapped places, with a bit of label re-sizing, was a good way for me to re-think my mental maps of the country, and that's really why I did them. Nothing profound.


You can probably read the text if you click to enlarge

I'm not asking for too much, am I?

I deliberately didn't add inset/locator maps to these

Too often we're blinded by the sun

Only peripheral if you're not paying attention

It's not that far away

A long way from London? 

Part of London?

Limited labels

I've gone crazy with the labels here

The Kingdom of Fife

I always think this part of the world is overlooked

Quite a big garden

So often overlooked

Definitely pretty central

Quite a bumpy landscape

A bit more label inversion here

Technically, this is not Shetland in a box

Greater Trowbridge?

Stafford and Cannock megaregion

There aren't a lot of maps of this area

There are a lot of people here

Like I said, this is just a few maps of places that we don't often see on maps. Or at least we maybe don't think of them as being nationally 'important' in the same we we do about major cities. In some ways that is understandable but I think it can't to any harm to change our mental maps and re-think how we think about the UK, where stuff is and where stuff should be.