This post has two main purposes. The first is to highlight the often weird and wonderful place names of Great Britain, including the village of Trumpet in Herefordshire, recently visited by my colleague Philip Brown - hence the title. The second purpose is to show anyone who is interested how to filter and find them using freely available Ordnance Survey data and free GIS software (QGIS). I'll start with a little bit of information about the data, then some maps of interesting place names, and then at the bottom I'll share more for any aspiring data boffins who might not yet know how to do this. I use these kinds of datasets in my QGIS training sessions, so that's the real reason I've been playing around with this stuff lately.
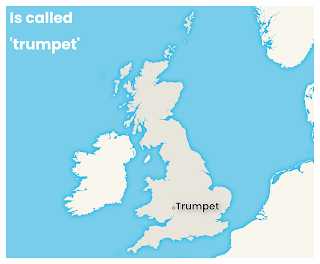 |
| Trumpet, Herefordshire |
The first step is to grab Ordnance Survey's OS Open Names dataset - a free download, available in several formats, and no registration required. There are nearly three million points in this dataset (2,952,321 as of the August 2021 file) and for each point we have the name of the feature in English, plus Gaelic or Welsh where applicable. You can read all about it in the official user guide, but for now all you need to know is that for each point there is a column which tells us whether it's a populated place, transport node, landform, some kind of landcover (e.g. a forest), hydrography (e.g. a loch) or 'other' (e.g. a primary school). For this little blog post, I filtered the data so it relates to populated places only, and this gets us a total of 43,120 places across Great Britain. This is how the places are broken down by type in the OS Open Names classification
There are four places called 'City' in Great Britain - two of these are hamlets and two are suburban areas. there is also one hamlet called 'Hamlet' and one suburban area called 'Hamlet'.
Maps of interesting place names
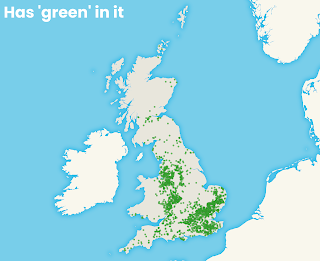
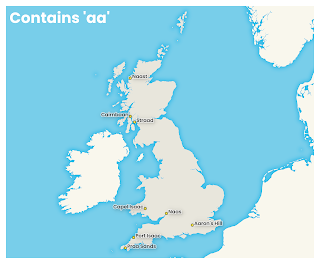
Right, let's try some maps of interesting place names now - I'll leave the labels on and messy, so you won't be able to see them all on every map but that's okay, this is just a bit of trivia.
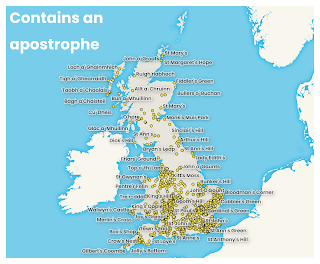 |
| Place's, right? |
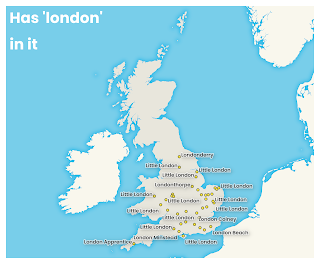 |
| Note 'London Apprentice' |
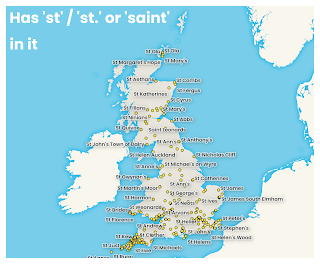 |
| Lots of Saints |
 |
| Map-on-the-blog |
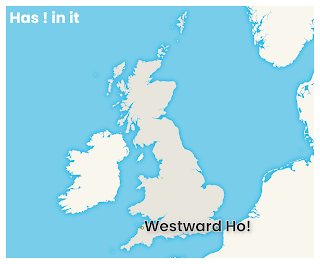 |
| The only exclamation in the nation |
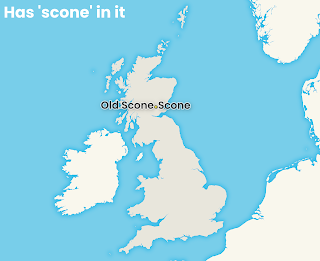 |
| Rhymes with scone |
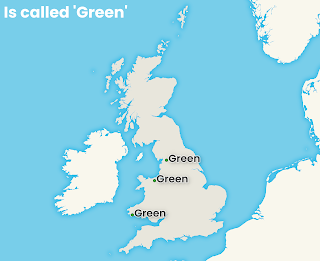 |
| Nicely lined up |
 |
| I detect a pattern |
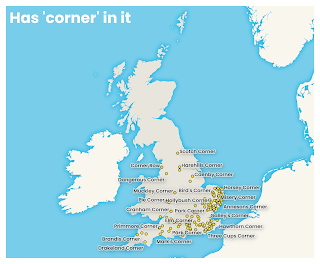 |
| England has cornered the market |
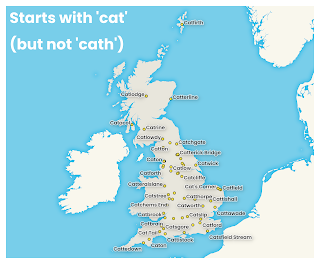 |
| Cat places |
 |
| Such vital, vital work |
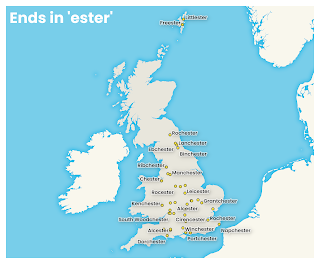 |
| Hello Romans |
Yes, you get the idea. I could go on forever but I won't - I'll just add a few more and then say a little about how to structure queries for this in QGIS.
 |
| How much longer caan I go on? |
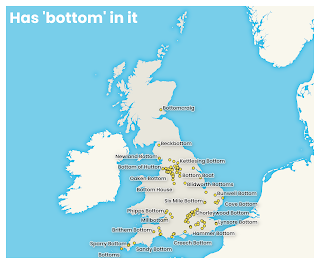 |
| I thought this should go at the bottom |
How to filter to find different places in QGIS
If you are a regular reader, or if you follow me on
twitter there is more than a tiny chance that you might already be a bit of a GIS nerd, so this bit may be surplus to requirements. If not, and you want to know how to filter layers in QGIS, read on.
In the final map above I have shown places containing the word 'bottom', because I am very mature. To do this in QGIS, all I did was right-click the layer in the Layers panel, click Filter... and then enter the correct query into the Provider Specific Filter Expression box, as you can see in my screenshot below.
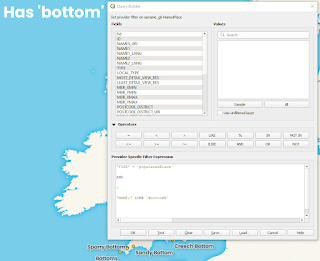 |
| This is using the OS Open Names points layer |
Here's the filter text, if you want to copy and paste it:
"TYPE" = 'populatedPlace'
AND
(
"NAME1" LIKE '%bottom%'
Explanation? There is a "TYPE" column and a "NAME1" column in the OS Open Names dataset so I've used these to filter the data to show only those places that are categorised as populated places, and only where the name contains the word 'bottom'.
On the last point, the LIKE operator looks for anything between single quotes - the % signs just ensure that QGIS finds anything with bottom, including anything with text before or after it. If you put in 'bottom' it would find only places called 'bottom', if you put in '%bottom' it would find only places ending in 'bottom' and if you put in 'bottom% it would find only places that start with 'bottom'. Note that you may read that the LIKE operator is case sensitive, but in my case I was using QGIS 3.16 and it was not case sensitive (I believe this is because only certain data types will require you to take case sensitivity into account - and in those cases you can just use the ILIKE operator).
Where you have variations of spellings, etc. then you might need to be a bit more creative - e.g. in the case of the 'st.' / 'st' / 'saint' map above. This was my query for that.
"TYPE" = 'populatedPlace'
AND
("NAME1" LIKE 'st. %' OR
"NAME1" LIKE 'st %' OR
"NAME1" LIKE 'saint %' )
One thing that can be confusing is how to search for text that contains an apostrophe, because if you just put one apostrophe between single apostrophes (i.e. single quotes) and % symbols then it won't work. The solution is to add two apostrophes, as below.
"TYPE" = 'populatedPlace'
AND
(
"NAME1" LIKE '%''%'
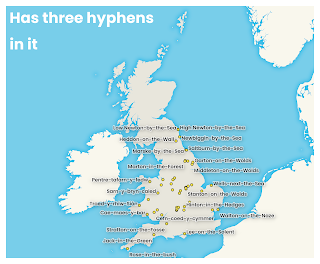
How about the hyphen-hyphen-hyphen one? Well, that goes like this:
"TYPE" = 'populatedPlace'
AND
("NAME1" LIKE '%-%-%-%')
If you just wanted to filter to show only places of your choosing, rather than filter to find some that contains certain bits of text, then it's just a case of using the IN operator and adding places in a comma separated list, in brackets, as shown below.
"TYPE" = 'populatedPlace'
AND
(
"NAME1" IN ('Aberdeen','London','Southampton','Middlesbrough','Liverpool')
Slightly different example below, where I've filtered the OS Open Names dataset using a different data type so that I can show all the 'lakes' in Scotland.
"TYPE" = 'hydrography'
AND
(
"NAME1" LIKE '%lake%' AND "COUNTRY" = 'Scotland'
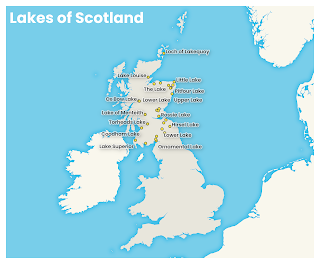 |
| Lots of these are tiny, but they do exist |
Hopefully you get the idea - hours of fun, limitless possibilities for silly blog posts, but ultimately all this is actually very useful (as well as simple) and it's the kind of thing I do day-to-day in the course of my work.
Thanks for reading.


