
So, you've heard about the mysterious 🌏 geometry generator 🌍in QGIS and you want to know more? You're in the right place. No idea what I'm talking about but you do use QGIS? Well you're still probably in the right place because I'm going to explain things here, with examples you can try yourself. I've put this post together for anyone who really wants to know what a geometry generator in QGIS can do. So before going any further here's a map of US states where I have used a geometry generator style to move Alaska and Hawaii below the lower 48 states as they often appear on US maps. Read all the way down to the bottom of the post if you also want to know how to use a geometry generator expression to create an entirely new layer where AK and HI are in the location shown below permanently!
 |
| The expression moves Alaska and Hawaii |
Geometry generator? Generators?
Let me say a little about terminology here, because it can be a bit confusing hearing people talk about 'geometry generator', 'the geometry generator', 'geometry generators' and various other terms. Don't worry about the precise term, it's all the same. Regardless of precise terminology The Geometry Generator in QGIS allows you to use expressions to create new points, lines or polygons on the fly during the rendering process.
Hmm, okay. What does this actually mean? It means that if you have, say, a shapefile of US states and you want to move Alaska and Hawaii to a position below the continental states you can do this using a geometry generator expression - no new shapefile is created and you aren't editing the original file, it's all done 'on the fly' - i.e. you make changes to the appearance of the layer without actually having to modify it's original properties or edit any features. That's why geometry generator appears within the Symbology option in map layers in QGIS.
So using a geometry generator is simply about changing the symbology of a layer in QGIS by using an expression, but without having to a) create any new files or b) edit the existing layer in any way? Yes, that's basically it.
I've found that the best way to understand what the geometry generator can do in QGIS is to have a go yourself, so with that in mind see if you can download the file below and add it to a new QGIS project. Once you've done that, go into the layer's Symbology and then once you're there click on Geometry Generator to look at the expression I've used to move Alaska and Hawaii. You can then edit the settings to see what happens.
Just note that in the example layer above the layer itself is in a coordinate reference system that uses metres, so the large numbers in the geometry generator expression (see below) refer to metres. If you are doing this kind of thing with a layer that has degrees as the map unit you will need to be aware of it. So, for example, you may want to move Alaska just a few degrees south, and not 1200000 as in the example I've given you!
 |
| Hopefully this makes things a bit clearer |
Some more geometry generator examples
If you search 'geometry generator' in the blog search box here you'll find some examples, but they are quite complex if you're new to it, so let me share some simpler ones now, starting by saying a little more about the US example I've provided above. In the first image below you can see where Alaska and Hawaii actually are (in yellow) and where I've moved them to using a geometry generator expression - and note that I've also scaled Alaska down 50% and rotated them so they look like other maps where AK and HI have been moved.
 |
| Original position vs new geometry generator position |
 |
| Once again, this explains the expression used to move AK and HI |
 |
| Loads of examples that have AK and HI below the lower 48 |
So what about other examples? Well I actually created a US lower 48 states file with loads of different geometry generator expressions in it that you can have a play around with, as well as a video that shows you how to do it. Here's the file - just download it and add it to a fresh, blank QGIS project:
Look out for the dancers at the end of the video above, by the way.
So, watch the video, download the file and then you'll see in much more detail than I can say here how things work. But, if you did want to make Texas much bigger - and only Texas - this is how you'd do it.
 |
| BIG TEXAS! |
If you wanted to take things a lot further and do strange stuff, see below - the point here is that once you know how it works you can use your imagination to do all sorts of things. Note that for all the expressions I've used you will be able to replicate them if you are on the latest version of QGIS (currently 3.22 or above).
 |
| An up to date version of QGIS is required |
Okay, here's a version where I've got a plain US states layer in the background and then one on top that uses a geometry generator expression to create little needle shapes that relate to population change between the 2010 and 2020 US Census. I have a much more detailed post on this kind of thing here.
 |
| See, you can do all sorts of cool stuff |
Since I'm in the UK, and since people sometimes move Shetland, you may find it useful to know how to do that if you were working with a UK local authorities file. If you want to replicate this, then here's the UK districts layer
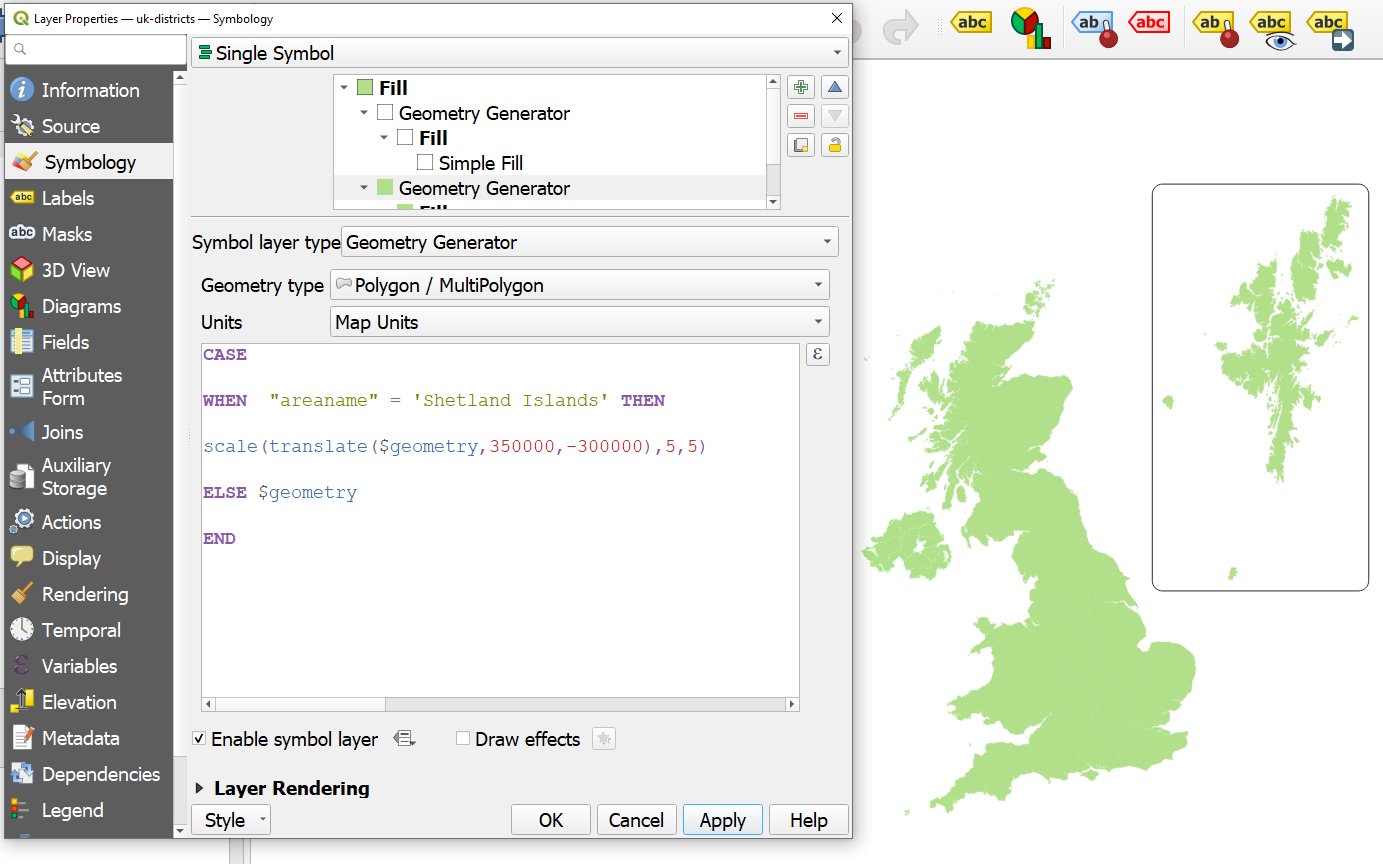 |
| I made Shetland 5 times bigger, just because |
Note that in the example above I also added a box round Shetland - a rounded box - if you look closely you'll see that I have two separate geometry generator symbols in the one layer here. See below for the expression I used to add the box - it's basically the same as the one I used to move Shetland but then I added a bounding box and a buffer distance too.
 |
| Shetland is indeed in a box, but it's also 5x bigger here |
For loads more examples, take a look at the video I posted above, which relates to the US lower 48 states layer I created with TONS of example expression in it that you can play with. This is a great way to learn more about the possibilities of geometry generator in QGIS. Here are a couple of screenshots showing you what's in that file. All you need to do is delete the -- in front of any of the expressions so that only one expression is active at a time and then you'll see what it does.
 |
| I put together loads of different expressions in this file |
 |
| Tons of different potential uses for this |
Wait, I can actually create new layers using geometry generator?!?! Yes!
This is a very important section. Yes, you can use geometry generator to style a layer to make it appear totally different from its original shape but if you want to create an entirely new layer that permanently looks different, based on a geometry generator expression then you can do this. Let's say you wanted to create a new US states layer where Alaska and Hawaii are always located below the lower 48 states. You can do this easily in QGIS by opening the Processing toolbox and then searching for 'Geometry by expression' and then you enter your geometry generator expression, choose where to save your new layer to and then that's that! It's amazingly easy and also very useful.
 |
| Create a new, modified layer using Geometry by expression |
If you wanted to create a new shapefile, say - or any other type of geo file - with Alaska and Hawaii permanently moved below the lower 48 states, you could just take the original US file I shared at the start of this post, then copy/paste the expression into the Geometry by expression tool as shown above and then run it. See below for a screenshot of where I've done this in QGIS myself.
 |
| A layer with AK and HI permanently moved |
Help! My shapes are disappearing
 |
| Stop AK and HI disappearing |
 |
| Sometimes you also need to change the Geometry type |
Where can I find out more?
There aren't a huge number of resources out there on using geometry generators in QGIS. Well, maybe there are but they are kind of scattered across the internet and they vary in quality. But if you do want to know a bit more and see examples of all sorts of interesting use cases then here are a few resources I recommend.
- Antonio Locandro on QGIS Geometry From Expression (see his videos in general - they are very good).
- North River Geographic on Geometry by Expressions (this is also fun)
- Anita Graser (the legend!) on using geometry generator symbol layers
- The Geometry Generator page from the QGIS 3.22 docs - note that the example here has multiple different expressions in it, with comments
- An excellent video tutorial on Geometry Generator by Klas Karlsson
- Lots of geometry generator examples, by Michel Stuyts
topical retweet https://t.co/x8lLaKhlcc
— Alasdair Rae (@undertheraedar) October 14, 2022


